Immigrants from Japan vs Immigrants from Eastern Asia Cognitive Disability
COMPARE
Immigrants from Japan
Immigrants from Eastern Asia
Cognitive Disability
Cognitive Disability Comparison
Immigrants from Japan
Immigrants from Eastern Asia
16.9%
COGNITIVE DISABILITY
96.2/ 100
METRIC RATING
117th/ 347
METRIC RANK
16.8%
COGNITIVE DISABILITY
97.9/ 100
METRIC RATING
105th/ 347
METRIC RANK
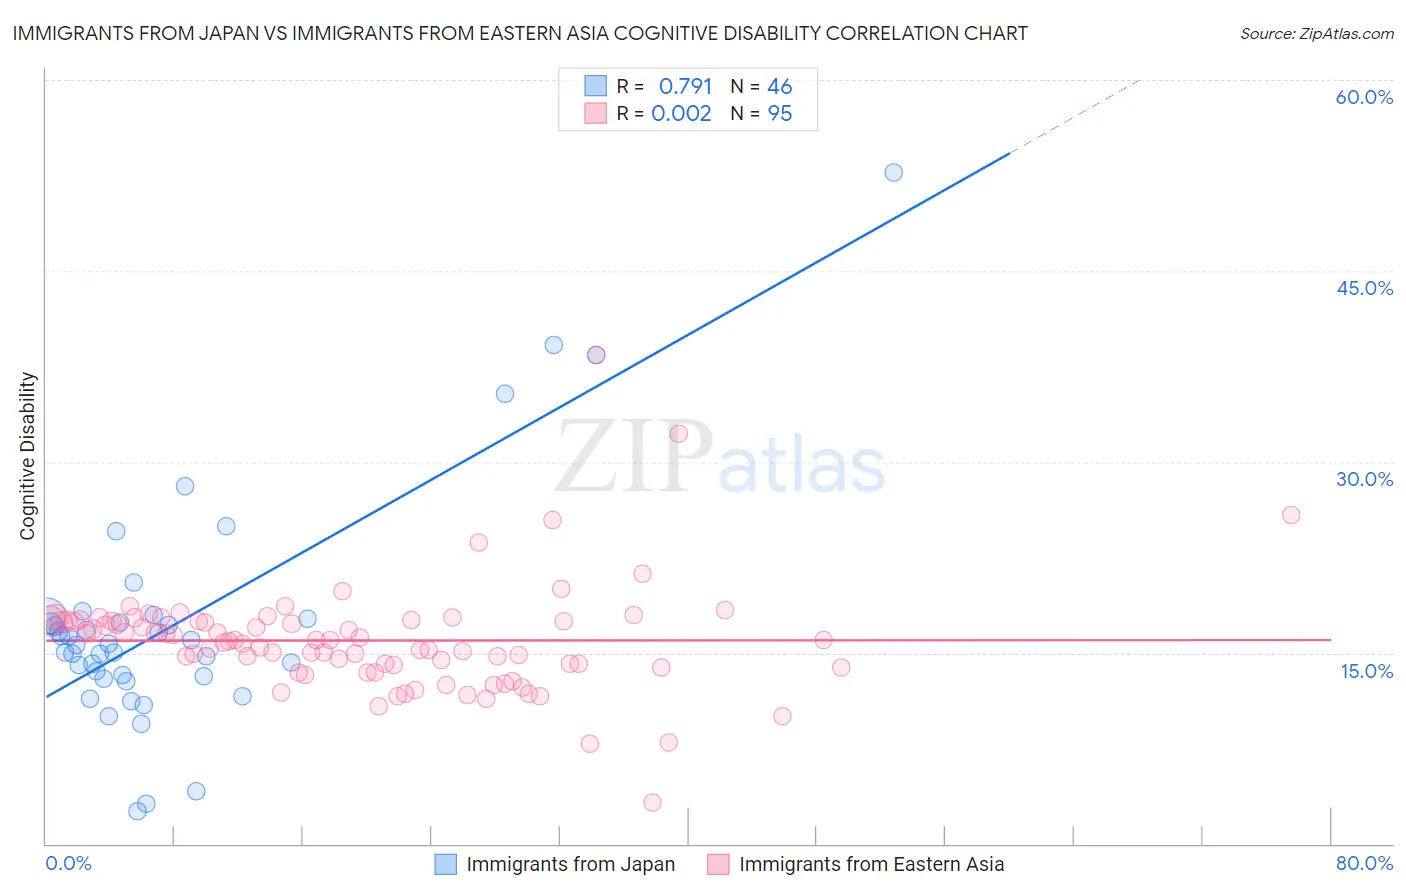
Immigrants from Japan vs Immigrants from Eastern Asia Cognitive Disability Correlation Chart
The statistical analysis conducted on geographies consisting of 340,148,832 people shows a strong positive correlation between the proportion of Immigrants from Japan and percentage of population with cognitive disability in the United States with a correlation coefficient (R) of 0.791 and weighted average of 16.9%. Similarly, the statistical analysis conducted on geographies consisting of 499,882,322 people shows no correlation between the proportion of Immigrants from Eastern Asia and percentage of population with cognitive disability in the United States with a correlation coefficient (R) of 0.002 and weighted average of 16.8%, a difference of 0.45%.
Cognitive Disability Correlation Summary
| Measurement | Immigrants from Japan | Immigrants from Eastern Asia |
| Minimum | 2.6% | 3.3% |
| Maximum | 52.8% | 38.4% |
| Range | 50.2% | 35.1% |
| Mean | 17.2% | 16.0% |
| Median | 15.7% | 16.0% |
| Interquartile 25% (IQ1) | 13.1% | 13.9% |
| Interquartile 75% (IQ3) | 17.7% | 17.5% |
| Interquartile Range (IQR) | 4.6% | 3.6% |
| Standard Deviation (Sample) | 9.1% | 4.3% |
| Standard Deviation (Population) | 9.0% | 4.3% |
Demographics Similar to Immigrants from Japan and Immigrants from Eastern Asia by Cognitive Disability
In terms of cognitive disability, the demographic groups most similar to Immigrants from Japan are Immigrants from Denmark (16.9%, a difference of 0.010%), Inupiat (16.9%, a difference of 0.050%), South African (16.9%, a difference of 0.13%), Yup'ik (16.9%, a difference of 0.15%), and Korean (16.8%, a difference of 0.20%). Similarly, the demographic groups most similar to Immigrants from Eastern Asia are Paraguayan (16.8%, a difference of 0.010%), Palestinian (16.8%, a difference of 0.010%), Northern European (16.8%, a difference of 0.040%), Irish (16.8%, a difference of 0.060%), and Immigrants from Nicaragua (16.8%, a difference of 0.060%).
| Demographics | Rating | Rank | Cognitive Disability |
| Immigrants | Asia | 98.1 /100 | #101 | Exceptional 16.8% |
| Irish | 98.1 /100 | #102 | Exceptional 16.8% |
| Paraguayans | 98.0 /100 | #103 | Exceptional 16.8% |
| Palestinians | 98.0 /100 | #104 | Exceptional 16.8% |
| Immigrants | Eastern Asia | 97.9 /100 | #105 | Exceptional 16.8% |
| Northern Europeans | 97.8 /100 | #106 | Exceptional 16.8% |
| Immigrants | Nicaragua | 97.8 /100 | #107 | Exceptional 16.8% |
| Canadians | 97.5 /100 | #108 | Exceptional 16.8% |
| Albanians | 97.3 /100 | #109 | Exceptional 16.8% |
| Arapaho | 97.3 /100 | #110 | Exceptional 16.8% |
| Uruguayans | 97.2 /100 | #111 | Exceptional 16.8% |
| Indians (Asian) | 97.2 /100 | #112 | Exceptional 16.8% |
| Immigrants | Sri Lanka | 97.1 /100 | #113 | Exceptional 16.8% |
| Koreans | 97.1 /100 | #114 | Exceptional 16.8% |
| Yup'ik | 96.9 /100 | #115 | Exceptional 16.9% |
| Inupiat | 96.5 /100 | #116 | Exceptional 16.9% |
| Immigrants | Japan | 96.2 /100 | #117 | Exceptional 16.9% |
| Immigrants | Denmark | 96.2 /100 | #118 | Exceptional 16.9% |
| South Africans | 95.5 /100 | #119 | Exceptional 16.9% |
| Scottish | 95.0 /100 | #120 | Exceptional 16.9% |
| Immigrants | China | 94.9 /100 | #121 | Exceptional 16.9% |