Spaniard vs Immigrants from Southern Europe Hearing Disability
COMPARE
Spaniard
Immigrants from Southern Europe
Hearing Disability
Hearing Disability Comparison
Spaniards
Immigrants from Southern Europe
3.5%
HEARING DISABILITY
0.1/ 100
METRIC RATING
268th/ 347
METRIC RANK
3.0%
HEARING DISABILITY
35.3/ 100
METRIC RATING
185th/ 347
METRIC RANK
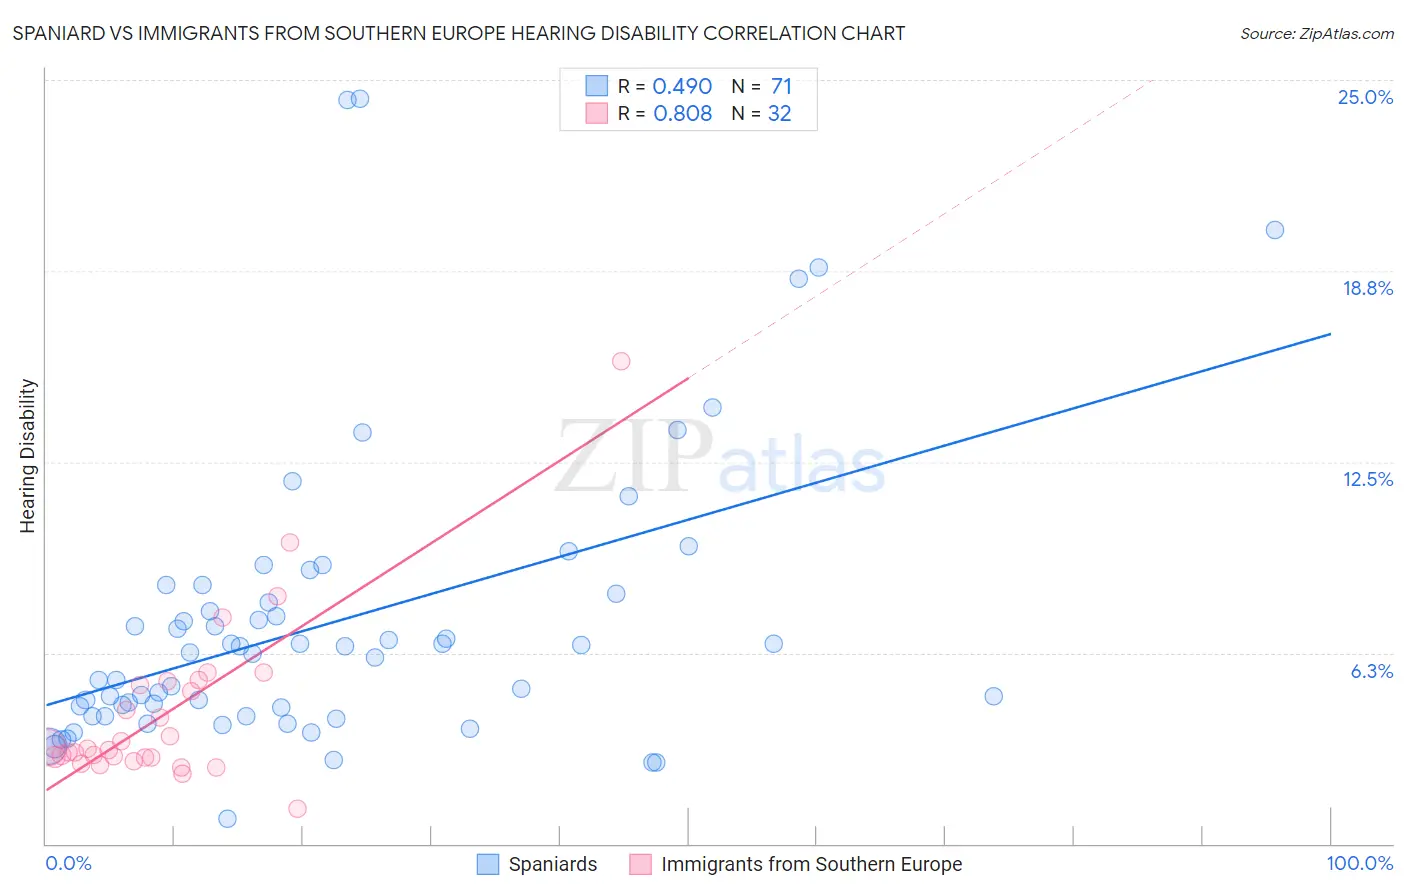
Spaniard vs Immigrants from Southern Europe Hearing Disability Correlation Chart
The statistical analysis conducted on geographies consisting of 443,274,447 people shows a moderate positive correlation between the proportion of Spaniards and percentage of population with hearing disability in the United States with a correlation coefficient (R) of 0.490 and weighted average of 3.5%. Similarly, the statistical analysis conducted on geographies consisting of 402,653,873 people shows a very strong positive correlation between the proportion of Immigrants from Southern Europe and percentage of population with hearing disability in the United States with a correlation coefficient (R) of 0.808 and weighted average of 3.0%, a difference of 14.8%.
Hearing Disability Correlation Summary
| Measurement | Spaniard | Immigrants from Southern Europe |
| Minimum | 0.81% | 1.1% |
| Maximum | 24.4% | 15.8% |
| Range | 23.6% | 14.7% |
| Mean | 7.2% | 4.3% |
| Median | 6.2% | 3.1% |
| Interquartile 25% (IQ1) | 4.2% | 2.8% |
| Interquartile 75% (IQ3) | 8.2% | 5.3% |
| Interquartile Range (IQR) | 4.0% | 2.4% |
| Standard Deviation (Sample) | 4.7% | 2.8% |
| Standard Deviation (Population) | 4.7% | 2.8% |
Similar Demographics by Hearing Disability
Demographics Similar to Spaniards by Hearing Disability
In terms of hearing disability, the demographic groups most similar to Spaniards are Canadian (3.5%, a difference of 0.020%), Belgian (3.5%, a difference of 0.24%), Ute (3.5%, a difference of 0.30%), British (3.5%, a difference of 0.42%), and Immigrants from Germany (3.5%, a difference of 0.44%).
| Demographics | Rating | Rank | Hearing Disability |
| Hawaiians | 0.1 /100 | #261 | Tragic 3.5% |
| Immigrants | North America | 0.1 /100 | #262 | Tragic 3.5% |
| Immigrants | Canada | 0.1 /100 | #263 | Tragic 3.5% |
| Immigrants | Germany | 0.1 /100 | #264 | Tragic 3.5% |
| British | 0.1 /100 | #265 | Tragic 3.5% |
| Belgians | 0.1 /100 | #266 | Tragic 3.5% |
| Canadians | 0.1 /100 | #267 | Tragic 3.5% |
| Spaniards | 0.1 /100 | #268 | Tragic 3.5% |
| Ute | 0.1 /100 | #269 | Tragic 3.5% |
| Europeans | 0.1 /100 | #270 | Tragic 3.5% |
| Czechs | 0.1 /100 | #271 | Tragic 3.5% |
| Fijians | 0.0 /100 | #272 | Tragic 3.5% |
| Puerto Ricans | 0.0 /100 | #273 | Tragic 3.5% |
| Swiss | 0.0 /100 | #274 | Tragic 3.5% |
| Czechoslovakians | 0.0 /100 | #275 | Tragic 3.6% |
Demographics Similar to Immigrants from Southern Europe by Hearing Disability
In terms of hearing disability, the demographic groups most similar to Immigrants from Southern Europe are Immigrants from Mexico (3.0%, a difference of 0.050%), Black/African American (3.0%, a difference of 0.060%), Mexican American Indian (3.0%, a difference of 0.070%), Immigrants from Ireland (3.0%, a difference of 0.21%), and African (3.0%, a difference of 0.25%).
| Demographics | Rating | Rank | Hearing Disability |
| Japanese | 46.0 /100 | #178 | Average 3.0% |
| Immigrants | Moldova | 43.1 /100 | #179 | Average 3.0% |
| Immigrants | Sweden | 42.4 /100 | #180 | Average 3.0% |
| Immigrants | Belgium | 41.5 /100 | #181 | Average 3.0% |
| Immigrants | Italy | 41.1 /100 | #182 | Average 3.0% |
| Bulgarians | 39.7 /100 | #183 | Fair 3.0% |
| Immigrants | Ireland | 37.4 /100 | #184 | Fair 3.0% |
| Immigrants | Southern Europe | 35.3 /100 | #185 | Fair 3.0% |
| Immigrants | Mexico | 34.9 /100 | #186 | Fair 3.0% |
| Blacks/African Americans | 34.7 /100 | #187 | Fair 3.0% |
| Mexican American Indians | 34.7 /100 | #188 | Fair 3.0% |
| Africans | 32.9 /100 | #189 | Fair 3.0% |
| Immigrants | South Africa | 31.1 /100 | #190 | Fair 3.1% |
| Immigrants | Switzerland | 28.8 /100 | #191 | Fair 3.1% |
| Koreans | 27.6 /100 | #192 | Fair 3.1% |