Bolivian vs Malaysian Hearing Disability
COMPARE
Bolivian
Malaysian
Hearing Disability
Hearing Disability Comparison
Bolivians
Malaysians
2.6%
HEARING DISABILITY
99.7/ 100
METRIC RATING
29th/ 347
METRIC RANK
3.2%
HEARING DISABILITY
6.6/ 100
METRIC RATING
220th/ 347
METRIC RANK
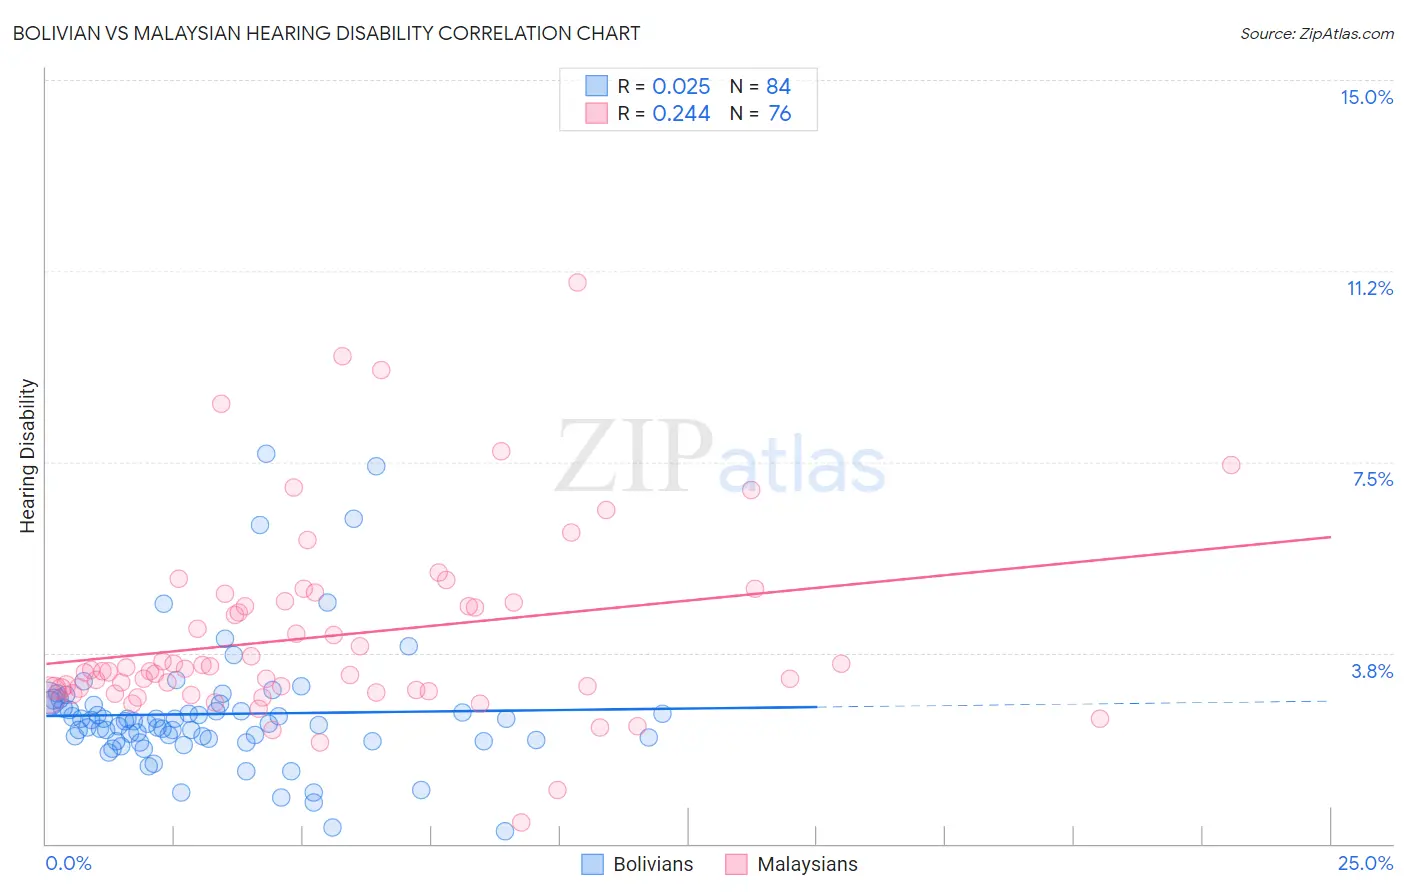
Bolivian vs Malaysian Hearing Disability Correlation Chart
The statistical analysis conducted on geographies consisting of 184,637,856 people shows no correlation between the proportion of Bolivians and percentage of population with hearing disability in the United States with a correlation coefficient (R) of 0.025 and weighted average of 2.6%. Similarly, the statistical analysis conducted on geographies consisting of 226,034,650 people shows a weak positive correlation between the proportion of Malaysians and percentage of population with hearing disability in the United States with a correlation coefficient (R) of 0.244 and weighted average of 3.2%, a difference of 22.7%.
Hearing Disability Correlation Summary
| Measurement | Bolivian | Malaysian |
| Minimum | 0.24% | 0.43% |
| Maximum | 7.7% | 11.0% |
| Range | 7.4% | 10.6% |
| Mean | 2.5% | 4.1% |
| Median | 2.4% | 3.4% |
| Interquartile 25% (IQ1) | 2.0% | 3.0% |
| Interquartile 75% (IQ3) | 2.7% | 4.8% |
| Interquartile Range (IQR) | 0.70% | 1.7% |
| Standard Deviation (Sample) | 1.2% | 1.9% |
| Standard Deviation (Population) | 1.2% | 1.9% |
Similar Demographics by Hearing Disability
Demographics Similar to Bolivians by Hearing Disability
In terms of hearing disability, the demographic groups most similar to Bolivians are Immigrants from Haiti (2.6%, a difference of 0.020%), Immigrants from Caribbean (2.6%, a difference of 0.080%), Immigrants from Cameroon (2.6%, a difference of 0.090%), Immigrants from Venezuela (2.6%, a difference of 0.23%), and Immigrants from South Central Asia (2.6%, a difference of 0.40%).
| Demographics | Rating | Rank | Hearing Disability |
| Immigrants | Sierra Leone | 99.8 /100 | #22 | Exceptional 2.6% |
| Immigrants | Nigeria | 99.8 /100 | #23 | Exceptional 2.6% |
| Immigrants | Ghana | 99.8 /100 | #24 | Exceptional 2.6% |
| Immigrants | El Salvador | 99.7 /100 | #25 | Exceptional 2.6% |
| Immigrants | Senegal | 99.7 /100 | #26 | Exceptional 2.6% |
| Immigrants | South Central Asia | 99.7 /100 | #27 | Exceptional 2.6% |
| Immigrants | Haiti | 99.7 /100 | #28 | Exceptional 2.6% |
| Bolivians | 99.7 /100 | #29 | Exceptional 2.6% |
| Immigrants | Caribbean | 99.7 /100 | #30 | Exceptional 2.6% |
| Immigrants | Cameroon | 99.7 /100 | #31 | Exceptional 2.6% |
| Immigrants | Venezuela | 99.7 /100 | #32 | Exceptional 2.6% |
| Filipinos | 99.6 /100 | #33 | Exceptional 2.6% |
| Immigrants | Pakistan | 99.6 /100 | #34 | Exceptional 2.6% |
| Salvadorans | 99.6 /100 | #35 | Exceptional 2.6% |
| Okinawans | 99.6 /100 | #36 | Exceptional 2.6% |
Demographics Similar to Malaysians by Hearing Disability
In terms of hearing disability, the demographic groups most similar to Malaysians are Immigrants from Laos (3.2%, a difference of 0.0%), Immigrants from Oceania (3.2%, a difference of 0.040%), New Zealander (3.2%, a difference of 0.060%), Immigrants from Northern Europe (3.2%, a difference of 0.12%), and Russian (3.2%, a difference of 0.16%).
| Demographics | Rating | Rank | Hearing Disability |
| Immigrants | Iraq | 10.5 /100 | #213 | Poor 3.1% |
| Australians | 8.1 /100 | #214 | Tragic 3.2% |
| Bangladeshis | 8.1 /100 | #215 | Tragic 3.2% |
| Immigrants | Norway | 7.3 /100 | #216 | Tragic 3.2% |
| Russians | 7.1 /100 | #217 | Tragic 3.2% |
| Immigrants | Northern Europe | 7.0 /100 | #218 | Tragic 3.2% |
| New Zealanders | 6.8 /100 | #219 | Tragic 3.2% |
| Malaysians | 6.6 /100 | #220 | Tragic 3.2% |
| Immigrants | Laos | 6.6 /100 | #221 | Tragic 3.2% |
| Immigrants | Oceania | 6.5 /100 | #222 | Tragic 3.2% |
| Mexicans | 5.6 /100 | #223 | Tragic 3.2% |
| Icelanders | 5.2 /100 | #224 | Tragic 3.2% |
| Latvians | 5.1 /100 | #225 | Tragic 3.2% |
| Lebanese | 5.0 /100 | #226 | Tragic 3.2% |
| Bhutanese | 4.6 /100 | #227 | Tragic 3.2% |