Immigrants from Micronesia vs Malaysian Hearing Disability
COMPARE
Immigrants from Micronesia
Malaysian
Hearing Disability
Hearing Disability Comparison
Immigrants from Micronesia
Malaysians
3.6%
HEARING DISABILITY
0.0/ 100
METRIC RATING
284th/ 347
METRIC RANK
3.2%
HEARING DISABILITY
6.6/ 100
METRIC RATING
220th/ 347
METRIC RANK
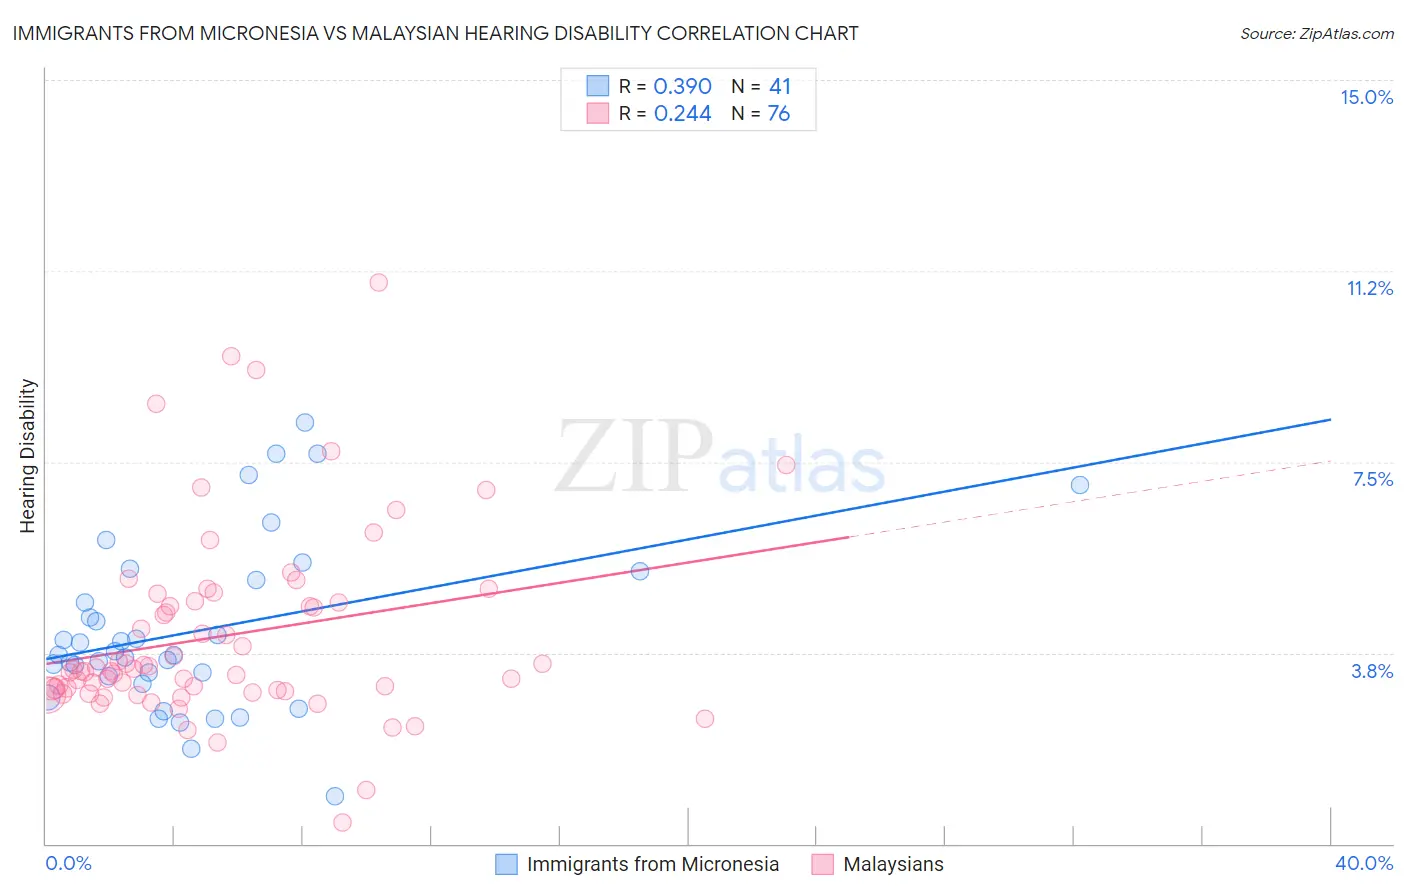
Immigrants from Micronesia vs Malaysian Hearing Disability Correlation Chart
The statistical analysis conducted on geographies consisting of 61,571,730 people shows a mild positive correlation between the proportion of Immigrants from Micronesia and percentage of population with hearing disability in the United States with a correlation coefficient (R) of 0.390 and weighted average of 3.6%. Similarly, the statistical analysis conducted on geographies consisting of 226,034,650 people shows a weak positive correlation between the proportion of Malaysians and percentage of population with hearing disability in the United States with a correlation coefficient (R) of 0.244 and weighted average of 3.2%, a difference of 14.3%.
Hearing Disability Correlation Summary
| Measurement | Immigrants from Micronesia | Malaysian |
| Minimum | 0.94% | 0.43% |
| Maximum | 8.3% | 11.0% |
| Range | 7.3% | 10.6% |
| Mean | 4.2% | 4.1% |
| Median | 3.7% | 3.4% |
| Interquartile 25% (IQ1) | 3.2% | 3.0% |
| Interquartile 75% (IQ3) | 5.3% | 4.8% |
| Interquartile Range (IQR) | 2.0% | 1.7% |
| Standard Deviation (Sample) | 1.7% | 1.9% |
| Standard Deviation (Population) | 1.7% | 1.9% |
Similar Demographics by Hearing Disability
Demographics Similar to Immigrants from Micronesia by Hearing Disability
In terms of hearing disability, the demographic groups most similar to Immigrants from Micronesia are Sioux (3.6%, a difference of 0.10%), Delaware (3.6%, a difference of 0.13%), Spanish (3.7%, a difference of 0.38%), Blackfeet (3.6%, a difference of 0.47%), and Swedish (3.6%, a difference of 0.72%).
| Demographics | Rating | Rank | Hearing Disability |
| Immigrants | Nonimmigrants | 0.0 /100 | #277 | Tragic 3.6% |
| Basques | 0.0 /100 | #278 | Tragic 3.6% |
| Slovaks | 0.0 /100 | #279 | Tragic 3.6% |
| French American Indians | 0.0 /100 | #280 | Tragic 3.6% |
| Scandinavians | 0.0 /100 | #281 | Tragic 3.6% |
| Swedes | 0.0 /100 | #282 | Tragic 3.6% |
| Blackfeet | 0.0 /100 | #283 | Tragic 3.6% |
| Immigrants | Micronesia | 0.0 /100 | #284 | Tragic 3.6% |
| Sioux | 0.0 /100 | #285 | Tragic 3.6% |
| Delaware | 0.0 /100 | #286 | Tragic 3.6% |
| Spanish | 0.0 /100 | #287 | Tragic 3.7% |
| Irish | 0.0 /100 | #288 | Tragic 3.7% |
| Chinese | 0.0 /100 | #289 | Tragic 3.7% |
| Whites/Caucasians | 0.0 /100 | #290 | Tragic 3.7% |
| Finns | 0.0 /100 | #291 | Tragic 3.7% |
Demographics Similar to Malaysians by Hearing Disability
In terms of hearing disability, the demographic groups most similar to Malaysians are Immigrants from Laos (3.2%, a difference of 0.0%), Immigrants from Oceania (3.2%, a difference of 0.040%), New Zealander (3.2%, a difference of 0.060%), Immigrants from Northern Europe (3.2%, a difference of 0.12%), and Russian (3.2%, a difference of 0.16%).
| Demographics | Rating | Rank | Hearing Disability |
| Immigrants | Iraq | 10.5 /100 | #213 | Poor 3.1% |
| Australians | 8.1 /100 | #214 | Tragic 3.2% |
| Bangladeshis | 8.1 /100 | #215 | Tragic 3.2% |
| Immigrants | Norway | 7.3 /100 | #216 | Tragic 3.2% |
| Russians | 7.1 /100 | #217 | Tragic 3.2% |
| Immigrants | Northern Europe | 7.0 /100 | #218 | Tragic 3.2% |
| New Zealanders | 6.8 /100 | #219 | Tragic 3.2% |
| Malaysians | 6.6 /100 | #220 | Tragic 3.2% |
| Immigrants | Laos | 6.6 /100 | #221 | Tragic 3.2% |
| Immigrants | Oceania | 6.5 /100 | #222 | Tragic 3.2% |
| Mexicans | 5.6 /100 | #223 | Tragic 3.2% |
| Icelanders | 5.2 /100 | #224 | Tragic 3.2% |
| Latvians | 5.1 /100 | #225 | Tragic 3.2% |
| Lebanese | 5.0 /100 | #226 | Tragic 3.2% |
| Bhutanese | 4.6 /100 | #227 | Tragic 3.2% |