Soviet Union vs Immigrants from Mexico Female Disability
COMPARE
Soviet Union
Immigrants from Mexico
Female Disability
Female Disability Comparison
Soviet Union
Immigrants from Mexico
11.7%
FEMALE DISABILITY
98.1/ 100
METRIC RATING
110th/ 347
METRIC RANK
12.2%
FEMALE DISABILITY
50.8/ 100
METRIC RATING
173rd/ 347
METRIC RANK
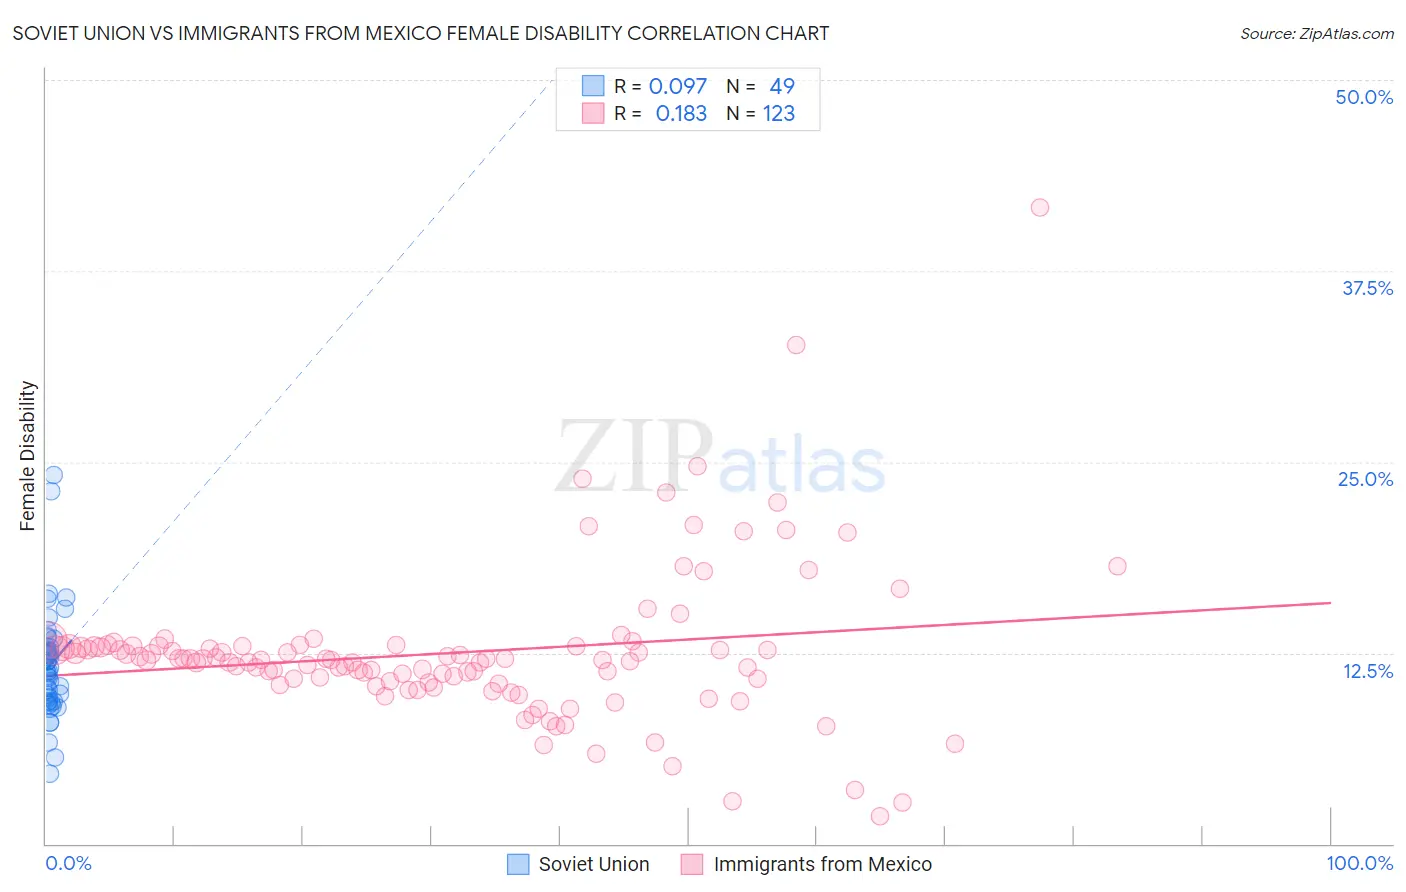
Soviet Union vs Immigrants from Mexico Female Disability Correlation Chart
The statistical analysis conducted on geographies consisting of 43,504,651 people shows a slight positive correlation between the proportion of Soviet Union and percentage of females with a disability in the United States with a correlation coefficient (R) of 0.097 and weighted average of 11.7%. Similarly, the statistical analysis conducted on geographies consisting of 513,519,603 people shows a poor positive correlation between the proportion of Immigrants from Mexico and percentage of females with a disability in the United States with a correlation coefficient (R) of 0.183 and weighted average of 12.2%, a difference of 3.8%.
Female Disability Correlation Summary
| Measurement | Soviet Union | Immigrants from Mexico |
| Minimum | 4.6% | 1.8% |
| Maximum | 24.1% | 41.7% |
| Range | 19.5% | 39.9% |
| Mean | 11.7% | 12.5% |
| Median | 11.3% | 12.1% |
| Interquartile 25% (IQ1) | 9.3% | 10.6% |
| Interquartile 75% (IQ3) | 12.9% | 12.9% |
| Interquartile Range (IQR) | 3.5% | 2.4% |
| Standard Deviation (Sample) | 3.5% | 5.0% |
| Standard Deviation (Population) | 3.5% | 5.0% |
Similar Demographics by Female Disability
Demographics Similar to Soviet Union by Female Disability
In terms of female disability, the demographic groups most similar to Soviet Union are Immigrants (11.7%, a difference of 0.0%), Costa Rican (11.7%, a difference of 0.020%), New Zealander (11.7%, a difference of 0.030%), Latvian (11.7%, a difference of 0.050%), and Immigrants from Greece (11.7%, a difference of 0.080%).
| Demographics | Rating | Rank | Female Disability |
| Immigrants | Eastern Africa | 98.3 /100 | #103 | Exceptional 11.7% |
| Immigrants | Western Asia | 98.3 /100 | #104 | Exceptional 11.7% |
| Australians | 98.3 /100 | #105 | Exceptional 11.7% |
| Immigrants | Greece | 98.2 /100 | #106 | Exceptional 11.7% |
| Latvians | 98.2 /100 | #107 | Exceptional 11.7% |
| New Zealanders | 98.1 /100 | #108 | Exceptional 11.7% |
| Immigrants | Immigrants | 98.1 /100 | #109 | Exceptional 11.7% |
| Soviet Union | 98.1 /100 | #110 | Exceptional 11.7% |
| Costa Ricans | 98.1 /100 | #111 | Exceptional 11.7% |
| Immigrants | Bangladesh | 97.8 /100 | #112 | Exceptional 11.8% |
| Immigrants | Belarus | 97.8 /100 | #113 | Exceptional 11.8% |
| South Africans | 97.7 /100 | #114 | Exceptional 11.8% |
| Brazilians | 97.7 /100 | #115 | Exceptional 11.8% |
| Immigrants | Morocco | 97.6 /100 | #116 | Exceptional 11.8% |
| Immigrants | Eastern Europe | 97.2 /100 | #117 | Exceptional 11.8% |
Demographics Similar to Immigrants from Mexico by Female Disability
In terms of female disability, the demographic groups most similar to Immigrants from Mexico are Immigrants from England (12.2%, a difference of 0.030%), Haitian (12.2%, a difference of 0.040%), Immigrants from St. Vincent and the Grenadines (12.2%, a difference of 0.040%), Immigrants from Southern Europe (12.2%, a difference of 0.21%), and Maltese (12.2%, a difference of 0.23%).
| Demographics | Rating | Rank | Female Disability |
| Lithuanians | 59.5 /100 | #166 | Average 12.2% |
| Immigrants | Latin America | 59.0 /100 | #167 | Average 12.2% |
| Immigrants | Haiti | 58.8 /100 | #168 | Average 12.2% |
| Lebanese | 58.1 /100 | #169 | Average 12.2% |
| Maltese | 57.0 /100 | #170 | Average 12.2% |
| Immigrants | Southern Europe | 56.3 /100 | #171 | Average 12.2% |
| Haitians | 51.9 /100 | #172 | Average 12.2% |
| Immigrants | Mexico | 50.8 /100 | #173 | Average 12.2% |
| Immigrants | England | 50.0 /100 | #174 | Average 12.2% |
| Immigrants | St. Vincent and the Grenadines | 49.7 /100 | #175 | Average 12.2% |
| Immigrants | Guyana | 43.1 /100 | #176 | Average 12.2% |
| Immigrants | Ghana | 42.5 /100 | #177 | Average 12.2% |
| Immigrants | Western Europe | 40.9 /100 | #178 | Average 12.2% |
| Immigrants | Fiji | 38.2 /100 | #179 | Fair 12.3% |
| Albanians | 37.9 /100 | #180 | Fair 12.3% |