Soviet Union vs Immigrants from Africa Female Disability
COMPARE
Soviet Union
Immigrants from Africa
Female Disability
Female Disability Comparison
Soviet Union
Immigrants from Africa
11.7%
FEMALE DISABILITY
98.1/ 100
METRIC RATING
110th/ 347
METRIC RANK
11.9%
FEMALE DISABILITY
90.0/ 100
METRIC RATING
142nd/ 347
METRIC RANK
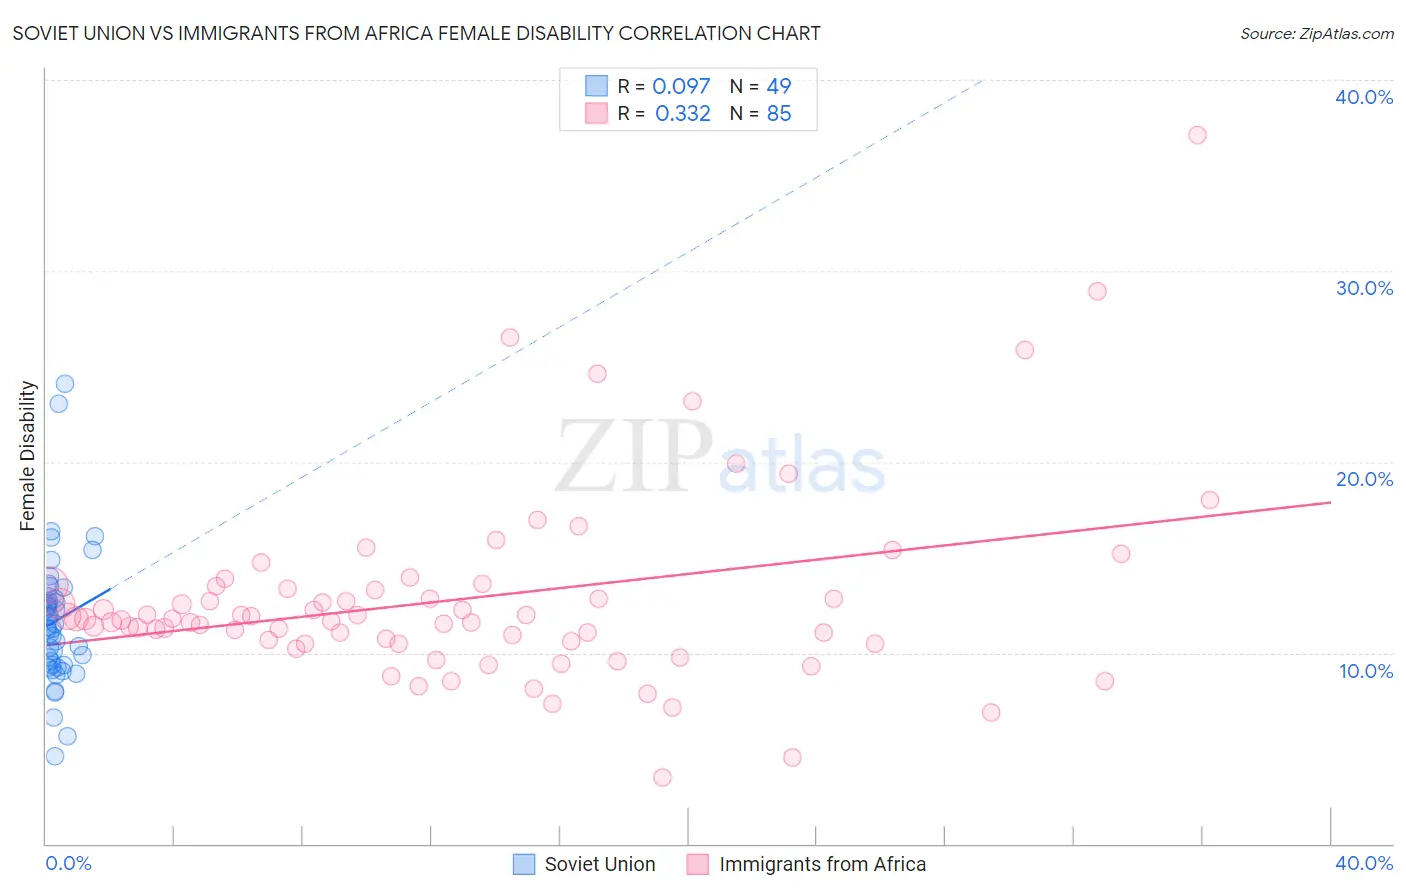
Soviet Union vs Immigrants from Africa Female Disability Correlation Chart
The statistical analysis conducted on geographies consisting of 43,504,651 people shows a slight positive correlation between the proportion of Soviet Union and percentage of females with a disability in the United States with a correlation coefficient (R) of 0.097 and weighted average of 11.7%. Similarly, the statistical analysis conducted on geographies consisting of 469,320,830 people shows a mild positive correlation between the proportion of Immigrants from Africa and percentage of females with a disability in the United States with a correlation coefficient (R) of 0.332 and weighted average of 11.9%, a difference of 1.7%.
Female Disability Correlation Summary
| Measurement | Soviet Union | Immigrants from Africa |
| Minimum | 4.6% | 3.5% |
| Maximum | 24.1% | 37.1% |
| Range | 19.5% | 33.7% |
| Mean | 11.7% | 12.8% |
| Median | 11.3% | 11.8% |
| Interquartile 25% (IQ1) | 9.3% | 10.5% |
| Interquartile 75% (IQ3) | 12.9% | 13.4% |
| Interquartile Range (IQR) | 3.5% | 2.9% |
| Standard Deviation (Sample) | 3.5% | 5.1% |
| Standard Deviation (Population) | 3.5% | 5.1% |
Similar Demographics by Female Disability
Demographics Similar to Soviet Union by Female Disability
In terms of female disability, the demographic groups most similar to Soviet Union are Immigrants (11.7%, a difference of 0.0%), Costa Rican (11.7%, a difference of 0.020%), New Zealander (11.7%, a difference of 0.030%), Latvian (11.7%, a difference of 0.050%), and Immigrants from Greece (11.7%, a difference of 0.080%).
| Demographics | Rating | Rank | Female Disability |
| Immigrants | Eastern Africa | 98.3 /100 | #103 | Exceptional 11.7% |
| Immigrants | Western Asia | 98.3 /100 | #104 | Exceptional 11.7% |
| Australians | 98.3 /100 | #105 | Exceptional 11.7% |
| Immigrants | Greece | 98.2 /100 | #106 | Exceptional 11.7% |
| Latvians | 98.2 /100 | #107 | Exceptional 11.7% |
| New Zealanders | 98.1 /100 | #108 | Exceptional 11.7% |
| Immigrants | Immigrants | 98.1 /100 | #109 | Exceptional 11.7% |
| Soviet Union | 98.1 /100 | #110 | Exceptional 11.7% |
| Costa Ricans | 98.1 /100 | #111 | Exceptional 11.7% |
| Immigrants | Bangladesh | 97.8 /100 | #112 | Exceptional 11.8% |
| Immigrants | Belarus | 97.8 /100 | #113 | Exceptional 11.8% |
| South Africans | 97.7 /100 | #114 | Exceptional 11.8% |
| Brazilians | 97.7 /100 | #115 | Exceptional 11.8% |
| Immigrants | Morocco | 97.6 /100 | #116 | Exceptional 11.8% |
| Immigrants | Eastern Europe | 97.2 /100 | #117 | Exceptional 11.8% |
Demographics Similar to Immigrants from Africa by Female Disability
In terms of female disability, the demographic groups most similar to Immigrants from Africa are Immigrants from Sudan (11.9%, a difference of 0.040%), Immigrants from Ecuador (11.9%, a difference of 0.17%), Romanian (11.9%, a difference of 0.19%), Immigrants from Austria (12.0%, a difference of 0.21%), and Estonian (12.0%, a difference of 0.21%).
| Demographics | Rating | Rank | Female Disability |
| Central Americans | 94.2 /100 | #135 | Exceptional 11.9% |
| Ugandans | 94.0 /100 | #136 | Exceptional 11.9% |
| Immigrants | Norway | 93.8 /100 | #137 | Exceptional 11.9% |
| Ecuadorians | 93.4 /100 | #138 | Exceptional 11.9% |
| Immigrants | Hungary | 92.8 /100 | #139 | Exceptional 11.9% |
| Romanians | 91.6 /100 | #140 | Exceptional 11.9% |
| Immigrants | Ecuador | 91.5 /100 | #141 | Exceptional 11.9% |
| Immigrants | Africa | 90.0 /100 | #142 | Excellent 11.9% |
| Immigrants | Sudan | 89.6 /100 | #143 | Excellent 11.9% |
| Immigrants | Austria | 87.9 /100 | #144 | Excellent 12.0% |
| Estonians | 87.8 /100 | #145 | Excellent 12.0% |
| Pakistanis | 84.6 /100 | #146 | Excellent 12.0% |
| Nigerians | 84.0 /100 | #147 | Excellent 12.0% |
| Immigrants | Kenya | 83.1 /100 | #148 | Excellent 12.0% |
| Greeks | 82.0 /100 | #149 | Excellent 12.0% |