South American vs Immigrants from Spain Disability
COMPARE
South American
Immigrants from Spain
Disability
Disability Comparison
South Americans
Immigrants from Spain
10.9%
DISABILITY
99.8/ 100
METRIC RATING
52nd/ 347
METRIC RANK
10.9%
DISABILITY
99.8/ 100
METRIC RATING
53rd/ 347
METRIC RANK
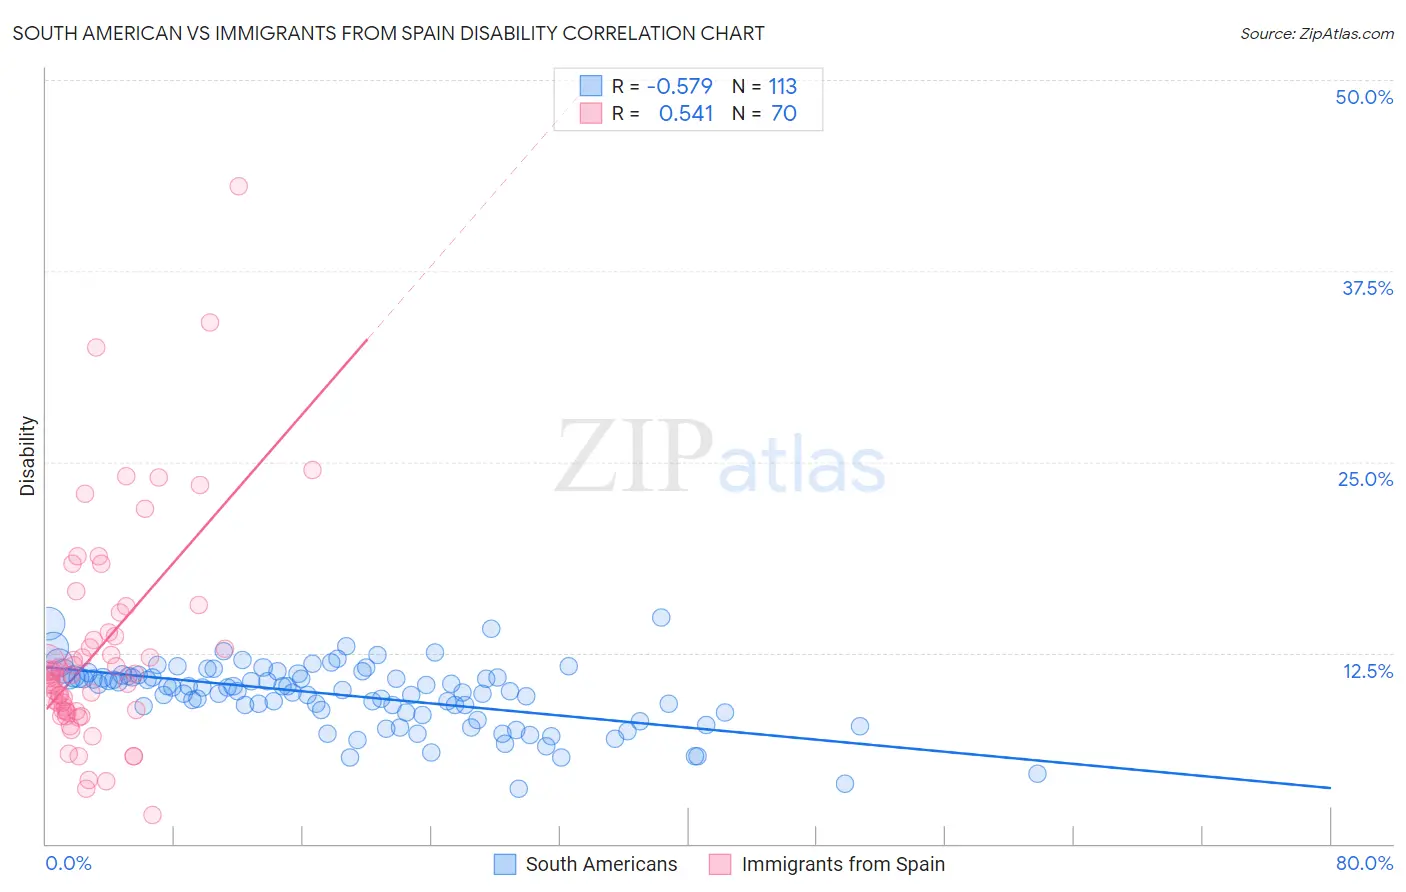
South American vs Immigrants from Spain Disability Correlation Chart
The statistical analysis conducted on geographies consisting of 494,088,856 people shows a substantial negative correlation between the proportion of South Americans and percentage of population with a disability in the United States with a correlation coefficient (R) of -0.579 and weighted average of 10.9%. Similarly, the statistical analysis conducted on geographies consisting of 239,685,180 people shows a substantial positive correlation between the proportion of Immigrants from Spain and percentage of population with a disability in the United States with a correlation coefficient (R) of 0.541 and weighted average of 10.9%, a difference of 0.020%.
Disability Correlation Summary
| Measurement | South American | Immigrants from Spain |
| Minimum | 3.6% | 1.9% |
| Maximum | 14.8% | 43.1% |
| Range | 11.3% | 41.2% |
| Mean | 9.7% | 12.7% |
| Median | 10.2% | 11.0% |
| Interquartile 25% (IQ1) | 8.6% | 8.7% |
| Interquartile 75% (IQ3) | 11.0% | 13.8% |
| Interquartile Range (IQR) | 2.4% | 5.1% |
| Standard Deviation (Sample) | 2.1% | 7.2% |
| Standard Deviation (Population) | 2.1% | 7.1% |
Demographics Similar to South Americans and Immigrants from Spain by Disability
In terms of disability, the demographic groups most similar to South Americans are Jordanian (10.9%, a difference of 0.020%), Peruvian (10.9%, a difference of 0.060%), Vietnamese (10.9%, a difference of 0.070%), Immigrants from Saudi Arabia (10.9%, a difference of 0.070%), and Immigrants from El Salvador (10.9%, a difference of 0.11%). Similarly, the demographic groups most similar to Immigrants from Spain are Jordanian (10.9%, a difference of 0.0%), Peruvian (10.9%, a difference of 0.080%), Vietnamese (10.9%, a difference of 0.090%), Immigrants from Saudi Arabia (10.9%, a difference of 0.090%), and Immigrants from El Salvador (10.9%, a difference of 0.090%).
| Demographics | Rating | Rank | Disability |
| Immigrants | Nepal | 99.9 /100 | #42 | Exceptional 10.8% |
| Israelis | 99.9 /100 | #43 | Exceptional 10.8% |
| Immigrants | Japan | 99.9 /100 | #44 | Exceptional 10.8% |
| Immigrants | Peru | 99.9 /100 | #45 | Exceptional 10.8% |
| Tongans | 99.9 /100 | #46 | Exceptional 10.8% |
| Taiwanese | 99.9 /100 | #47 | Exceptional 10.8% |
| Soviet Union | 99.9 /100 | #48 | Exceptional 10.9% |
| Vietnamese | 99.9 /100 | #49 | Exceptional 10.9% |
| Immigrants | Saudi Arabia | 99.9 /100 | #50 | Exceptional 10.9% |
| Peruvians | 99.8 /100 | #51 | Exceptional 10.9% |
| South Americans | 99.8 /100 | #52 | Exceptional 10.9% |
| Immigrants | Spain | 99.8 /100 | #53 | Exceptional 10.9% |
| Jordanians | 99.8 /100 | #54 | Exceptional 10.9% |
| Immigrants | El Salvador | 99.8 /100 | #55 | Exceptional 10.9% |
| Immigrants | Lithuania | 99.8 /100 | #56 | Exceptional 10.9% |
| Salvadorans | 99.8 /100 | #57 | Exceptional 10.9% |
| Immigrants | South America | 99.8 /100 | #58 | Exceptional 10.9% |
| Immigrants | Colombia | 99.7 /100 | #59 | Exceptional 10.9% |
| Zimbabweans | 99.7 /100 | #60 | Exceptional 10.9% |
| Immigrants | Bulgaria | 99.7 /100 | #61 | Exceptional 10.9% |
| Immigrants | Northern Africa | 99.7 /100 | #62 | Exceptional 10.9% |