Danish vs Immigrants from Armenia Cognitive Disability
COMPARE
Danish
Immigrants from Armenia
Cognitive Disability
Cognitive Disability Comparison
Danes
Immigrants from Armenia
16.7%
COGNITIVE DISABILITY
98.8/ 100
METRIC RATING
91st/ 347
METRIC RANK
17.9%
COGNITIVE DISABILITY
0.6/ 100
METRIC RATING
258th/ 347
METRIC RANK
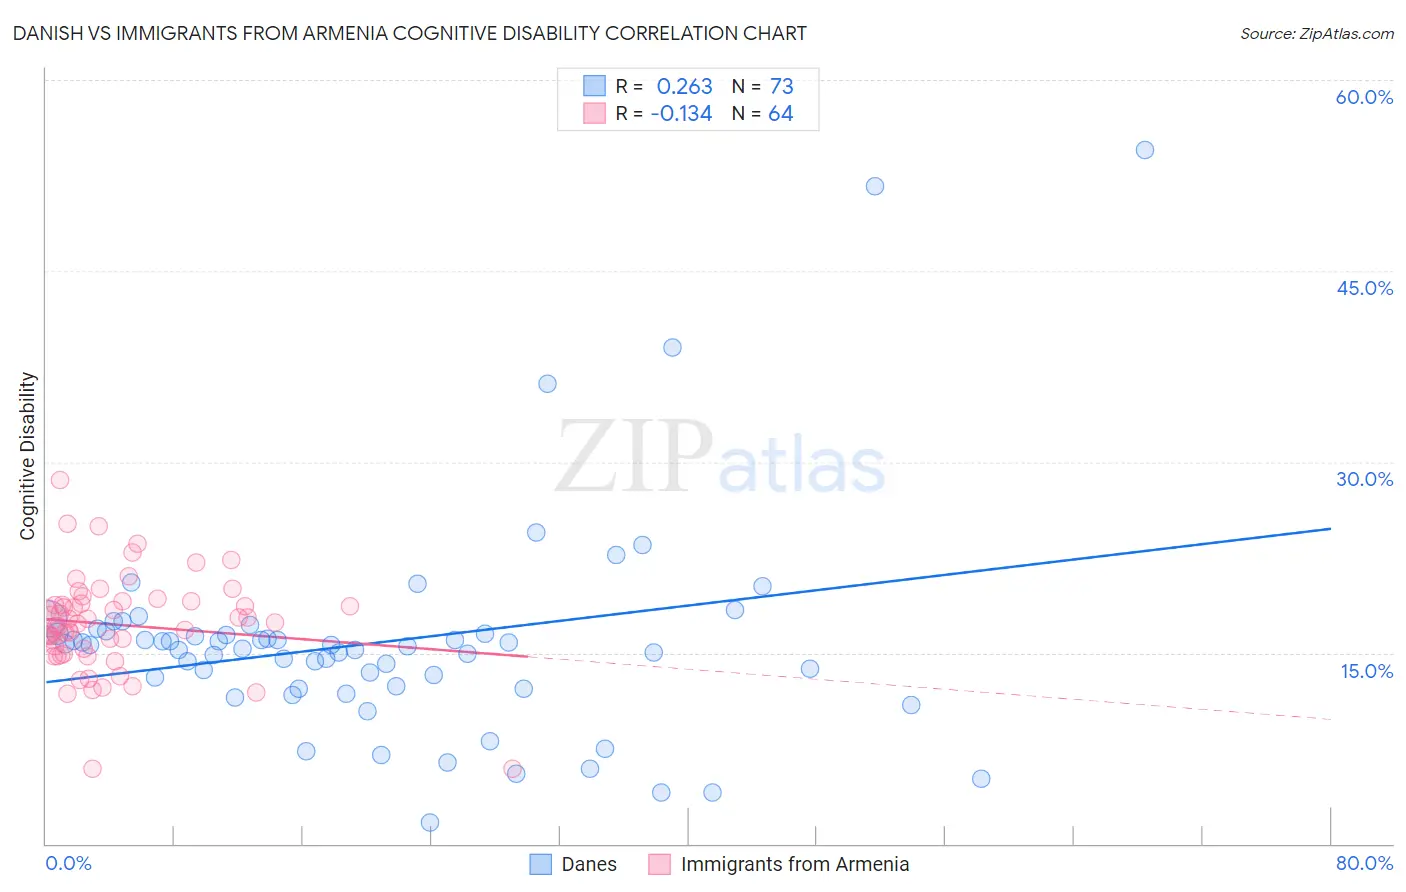
Danish vs Immigrants from Armenia Cognitive Disability Correlation Chart
The statistical analysis conducted on geographies consisting of 474,128,115 people shows a weak positive correlation between the proportion of Danes and percentage of population with cognitive disability in the United States with a correlation coefficient (R) of 0.263 and weighted average of 16.7%. Similarly, the statistical analysis conducted on geographies consisting of 97,717,666 people shows a poor negative correlation between the proportion of Immigrants from Armenia and percentage of population with cognitive disability in the United States with a correlation coefficient (R) of -0.134 and weighted average of 17.9%, a difference of 7.0%.
Cognitive Disability Correlation Summary
| Measurement | Danish | Immigrants from Armenia |
| Minimum | 1.7% | 5.9% |
| Maximum | 54.5% | 28.6% |
| Range | 52.9% | 22.7% |
| Mean | 15.8% | 17.2% |
| Median | 15.5% | 17.4% |
| Interquartile 25% (IQ1) | 12.3% | 15.2% |
| Interquartile 75% (IQ3) | 16.6% | 18.9% |
| Interquartile Range (IQR) | 4.3% | 3.8% |
| Standard Deviation (Sample) | 8.6% | 3.9% |
| Standard Deviation (Population) | 8.6% | 3.9% |
Similar Demographics by Cognitive Disability
Demographics Similar to Danes by Cognitive Disability
In terms of cognitive disability, the demographic groups most similar to Danes are Immigrants from Egypt (16.7%, a difference of 0.010%), South American (16.7%, a difference of 0.010%), Immigrants from South America (16.7%, a difference of 0.010%), Immigrants from Southern Europe (16.7%, a difference of 0.020%), and Asian (16.7%, a difference of 0.060%).
| Demographics | Rating | Rank | Cognitive Disability |
| Belgians | 99.1 /100 | #84 | Exceptional 16.7% |
| Immigrants | Moldova | 99.1 /100 | #85 | Exceptional 16.7% |
| Immigrants | South Africa | 99.0 /100 | #86 | Exceptional 16.7% |
| Native Hawaiians | 99.0 /100 | #87 | Exceptional 16.7% |
| Immigrants | Philippines | 99.0 /100 | #88 | Exceptional 16.7% |
| Immigrants | Egypt | 98.8 /100 | #89 | Exceptional 16.7% |
| South Americans | 98.8 /100 | #90 | Exceptional 16.7% |
| Danes | 98.8 /100 | #91 | Exceptional 16.7% |
| Immigrants | South America | 98.8 /100 | #92 | Exceptional 16.7% |
| Immigrants | Southern Europe | 98.7 /100 | #93 | Exceptional 16.7% |
| Asians | 98.7 /100 | #94 | Exceptional 16.7% |
| English | 98.6 /100 | #95 | Exceptional 16.8% |
| Finns | 98.5 /100 | #96 | Exceptional 16.8% |
| Dutch | 98.5 /100 | #97 | Exceptional 16.8% |
| Immigrants | Lebanon | 98.4 /100 | #98 | Exceptional 16.8% |
Demographics Similar to Immigrants from Armenia by Cognitive Disability
In terms of cognitive disability, the demographic groups most similar to Immigrants from Armenia are Mexican American Indian (17.9%, a difference of 0.010%), Immigrants from the Azores (17.9%, a difference of 0.050%), Bahamian (17.9%, a difference of 0.050%), Hopi (17.9%, a difference of 0.060%), and Hispanic or Latino (17.9%, a difference of 0.060%).
| Demographics | Rating | Rank | Cognitive Disability |
| Malaysians | 0.6 /100 | #251 | Tragic 17.9% |
| Immigrants | Grenada | 0.6 /100 | #252 | Tragic 17.9% |
| Hopi | 0.6 /100 | #253 | Tragic 17.9% |
| Hispanics or Latinos | 0.6 /100 | #254 | Tragic 17.9% |
| Immigrants | Azores | 0.6 /100 | #255 | Tragic 17.9% |
| Bahamians | 0.6 /100 | #256 | Tragic 17.9% |
| Mexican American Indians | 0.6 /100 | #257 | Tragic 17.9% |
| Immigrants | Armenia | 0.6 /100 | #258 | Tragic 17.9% |
| Ethiopians | 0.5 /100 | #259 | Tragic 17.9% |
| Immigrants | Belize | 0.5 /100 | #260 | Tragic 17.9% |
| Guamanians/Chamorros | 0.5 /100 | #261 | Tragic 17.9% |
| Sierra Leoneans | 0.4 /100 | #262 | Tragic 17.9% |
| Immigrants | Barbados | 0.4 /100 | #263 | Tragic 17.9% |
| Menominee | 0.4 /100 | #264 | Tragic 18.0% |
| Spanish Americans | 0.4 /100 | #265 | Tragic 18.0% |