South African vs Comanche Single Father Households
COMPARE
South African
Comanche
Single Father Households
Single Father Households Comparison
South Africans
Comanche
2.1%
SINGLE FATHER HOUSEHOLDS
99.1/ 100
METRIC RATING
99th/ 347
METRIC RANK
2.5%
SINGLE FATHER HOUSEHOLDS
1.0/ 100
METRIC RATING
259th/ 347
METRIC RANK
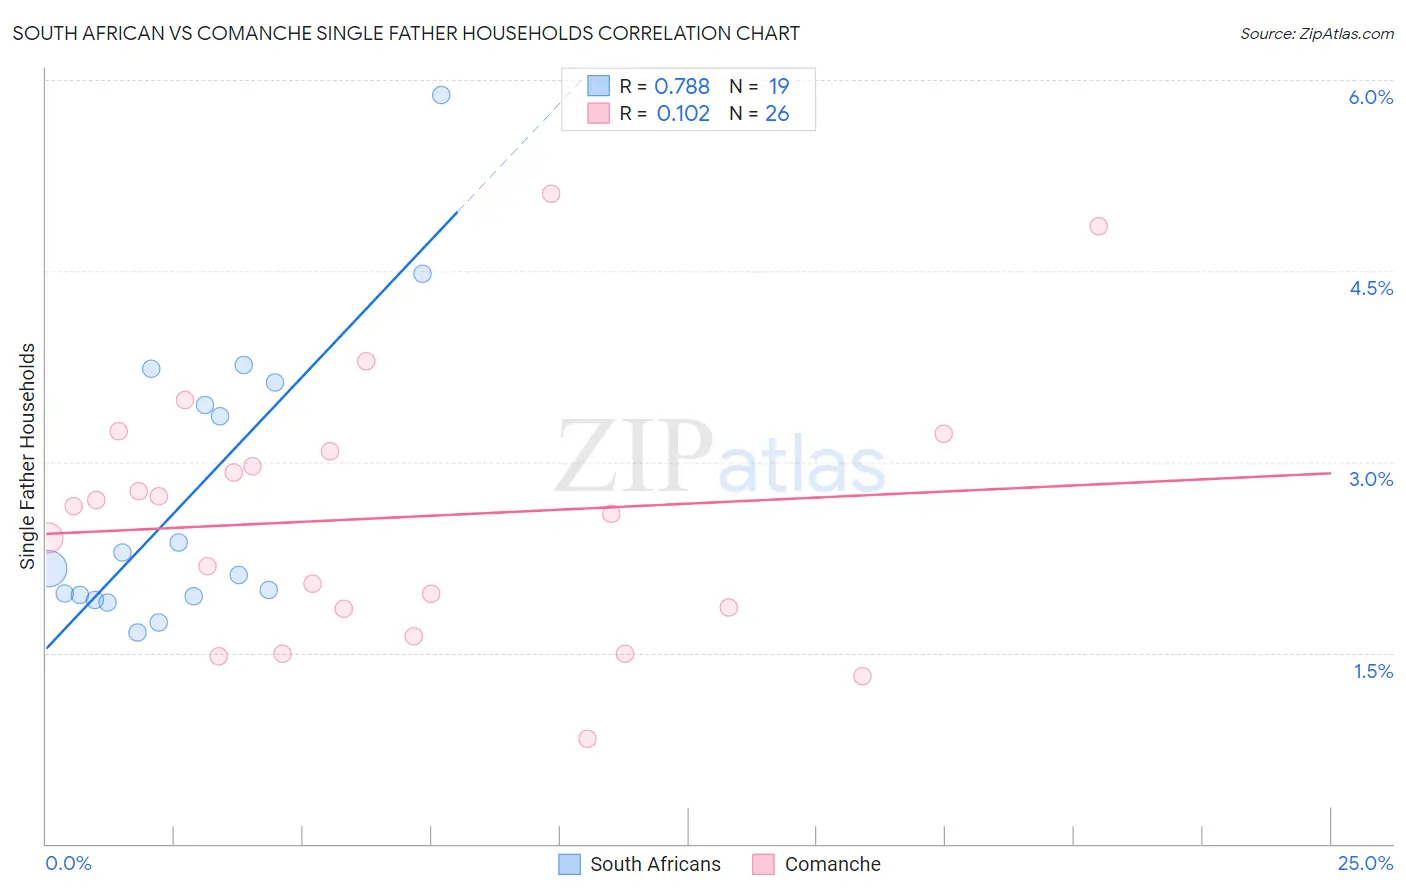
South African vs Comanche Single Father Households Correlation Chart
The statistical analysis conducted on geographies consisting of 181,721,596 people shows a strong positive correlation between the proportion of South Africans and percentage of single father households in the United States with a correlation coefficient (R) of 0.788 and weighted average of 2.1%. Similarly, the statistical analysis conducted on geographies consisting of 109,445,833 people shows a poor positive correlation between the proportion of Comanche and percentage of single father households in the United States with a correlation coefficient (R) of 0.102 and weighted average of 2.5%, a difference of 18.5%.
Single Father Households Correlation Summary
| Measurement | South African | Comanche |
| Minimum | 1.7% | 0.82% |
| Maximum | 5.9% | 5.1% |
| Range | 4.2% | 4.3% |
| Mean | 2.8% | 2.6% |
| Median | 2.2% | 2.6% |
| Interquartile 25% (IQ1) | 1.9% | 1.8% |
| Interquartile 75% (IQ3) | 3.6% | 3.1% |
| Interquartile Range (IQR) | 1.7% | 1.2% |
| Standard Deviation (Sample) | 1.1% | 1.0% |
| Standard Deviation (Population) | 1.1% | 1.0% |
Similar Demographics by Single Father Households
Demographics Similar to South Africans by Single Father Households
In terms of single father households, the demographic groups most similar to South Africans are Guyanese (2.1%, a difference of 0.040%), Immigrants from Northern Africa (2.1%, a difference of 0.15%), Immigrants from Moldova (2.1%, a difference of 0.17%), Arab (2.1%, a difference of 0.30%), and Immigrants from Western Europe (2.1%, a difference of 0.30%).
| Demographics | Rating | Rank | Single Father Households |
| Romanians | 99.4 /100 | #92 | Exceptional 2.1% |
| Croatians | 99.3 /100 | #93 | Exceptional 2.1% |
| Ukrainians | 99.3 /100 | #94 | Exceptional 2.1% |
| Bermudans | 99.2 /100 | #95 | Exceptional 2.1% |
| Arabs | 99.2 /100 | #96 | Exceptional 2.1% |
| Immigrants | Moldova | 99.1 /100 | #97 | Exceptional 2.1% |
| Guyanese | 99.1 /100 | #98 | Exceptional 2.1% |
| South Africans | 99.1 /100 | #99 | Exceptional 2.1% |
| Immigrants | Northern Africa | 99.0 /100 | #100 | Exceptional 2.1% |
| Immigrants | Western Europe | 98.9 /100 | #101 | Exceptional 2.1% |
| Argentineans | 98.9 /100 | #102 | Exceptional 2.1% |
| Lebanese | 98.9 /100 | #103 | Exceptional 2.1% |
| Alsatians | 98.9 /100 | #104 | Exceptional 2.1% |
| Palestinians | 98.6 /100 | #105 | Exceptional 2.2% |
| Immigrants | Southern Europe | 98.6 /100 | #106 | Exceptional 2.2% |
Demographics Similar to Comanche by Single Father Households
In terms of single father households, the demographic groups most similar to Comanche are Immigrants from Caribbean (2.5%, a difference of 0.090%), Spanish (2.5%, a difference of 0.16%), Immigrants from Congo (2.5%, a difference of 0.24%), Immigrants from Belize (2.5%, a difference of 0.25%), and Immigrants from Liberia (2.5%, a difference of 0.40%).
| Demographics | Rating | Rank | Single Father Households |
| Immigrants | Eritrea | 2.0 /100 | #252 | Tragic 2.5% |
| Immigrants | Somalia | 1.9 /100 | #253 | Tragic 2.5% |
| Immigrants | Thailand | 1.8 /100 | #254 | Tragic 2.5% |
| Tongans | 1.5 /100 | #255 | Tragic 2.5% |
| Potawatomi | 1.4 /100 | #256 | Tragic 2.5% |
| Immigrants | Congo | 1.2 /100 | #257 | Tragic 2.5% |
| Spanish | 1.1 /100 | #258 | Tragic 2.5% |
| Comanche | 1.0 /100 | #259 | Tragic 2.5% |
| Immigrants | Caribbean | 1.0 /100 | #260 | Tragic 2.5% |
| Immigrants | Belize | 0.9 /100 | #261 | Tragic 2.5% |
| Immigrants | Liberia | 0.8 /100 | #262 | Tragic 2.5% |
| Dominicans | 0.8 /100 | #263 | Tragic 2.5% |
| Indonesians | 0.5 /100 | #264 | Tragic 2.6% |
| Immigrants | Micronesia | 0.5 /100 | #265 | Tragic 2.6% |
| French American Indians | 0.5 /100 | #266 | Tragic 2.6% |