South African vs Comanche Unemployment
COMPARE
South African
Comanche
Unemployment
Unemployment Comparison
South Africans
Comanche
5.1%
UNEMPLOYMENT
92.6/ 100
METRIC RATING
112th/ 347
METRIC RANK
5.5%
UNEMPLOYMENT
4.9/ 100
METRIC RATING
232nd/ 347
METRIC RANK
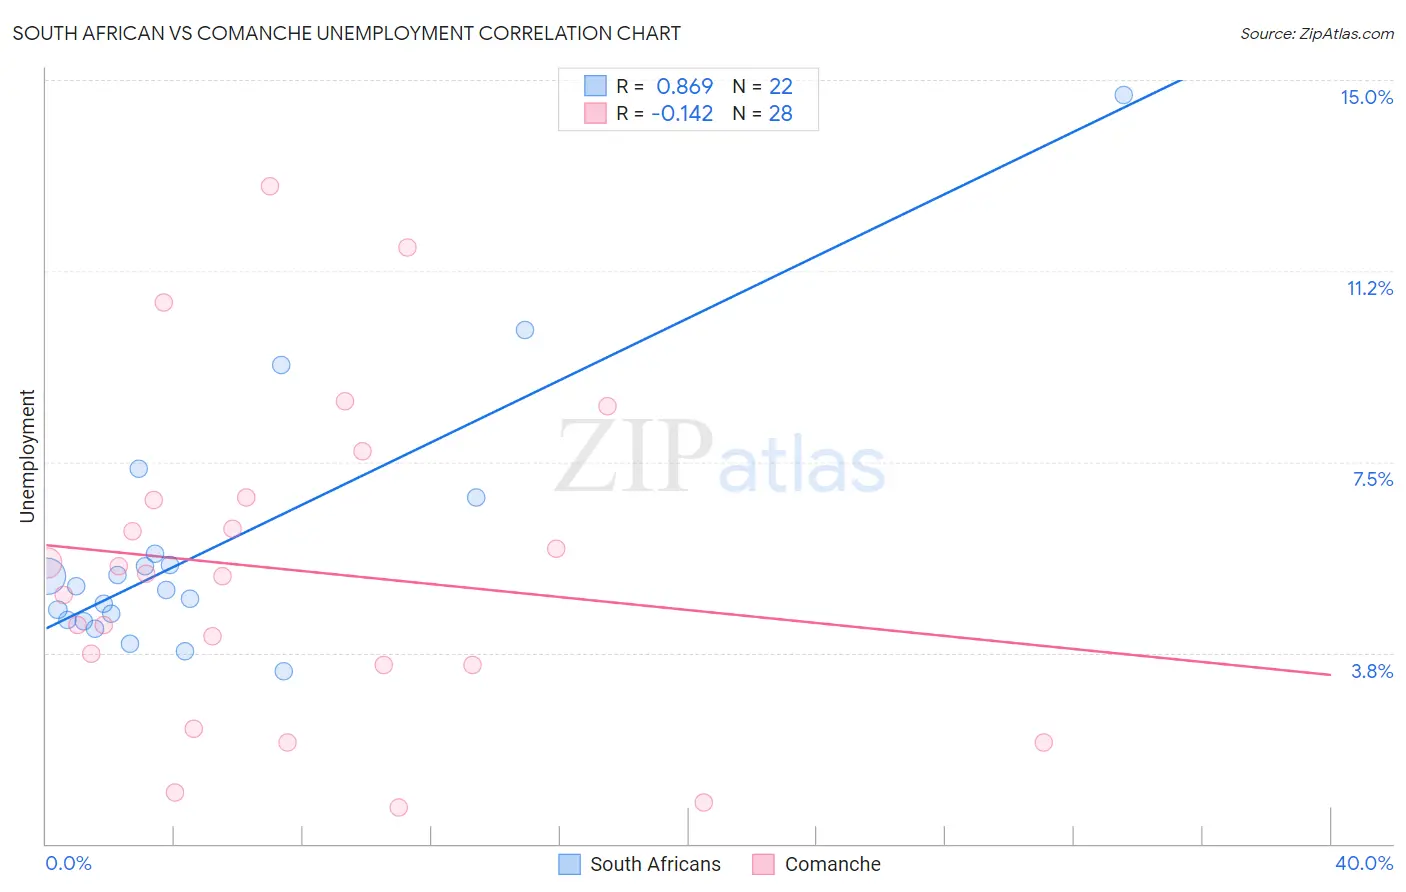
South African vs Comanche Unemployment Correlation Chart
The statistical analysis conducted on geographies consisting of 182,514,846 people shows a very strong positive correlation between the proportion of South Africans and unemployment in the United States with a correlation coefficient (R) of 0.869 and weighted average of 5.1%. Similarly, the statistical analysis conducted on geographies consisting of 109,712,391 people shows a poor negative correlation between the proportion of Comanche and unemployment in the United States with a correlation coefficient (R) of -0.142 and weighted average of 5.5%, a difference of 8.8%.
Unemployment Correlation Summary
| Measurement | South African | Comanche |
| Minimum | 3.4% | 0.70% |
| Maximum | 14.7% | 12.9% |
| Range | 11.3% | 12.2% |
| Mean | 5.8% | 5.4% |
| Median | 5.0% | 5.3% |
| Interquartile 25% (IQ1) | 4.4% | 3.5% |
| Interquartile 75% (IQ3) | 5.7% | 6.8% |
| Interquartile Range (IQR) | 1.3% | 3.3% |
| Standard Deviation (Sample) | 2.6% | 3.1% |
| Standard Deviation (Population) | 2.5% | 3.1% |
Similar Demographics by Unemployment
Demographics Similar to South Africans by Unemployment
In terms of unemployment, the demographic groups most similar to South Africans are Argentinean (5.1%, a difference of 0.040%), Immigrants from Ireland (5.1%, a difference of 0.10%), Immigrants from Lithuania (5.0%, a difference of 0.16%), Chilean (5.0%, a difference of 0.16%), and Immigrants from Eritrea (5.0%, a difference of 0.18%).
| Demographics | Rating | Rank | Unemployment |
| Maltese | 94.0 /100 | #105 | Exceptional 5.0% |
| Immigrants | Romania | 93.7 /100 | #106 | Exceptional 5.0% |
| Immigrants | Turkey | 93.7 /100 | #107 | Exceptional 5.0% |
| Immigrants | Kuwait | 93.7 /100 | #108 | Exceptional 5.0% |
| Immigrants | Eritrea | 93.3 /100 | #109 | Exceptional 5.0% |
| Immigrants | Lithuania | 93.2 /100 | #110 | Exceptional 5.0% |
| Chileans | 93.2 /100 | #111 | Exceptional 5.0% |
| South Africans | 92.6 /100 | #112 | Exceptional 5.1% |
| Argentineans | 92.4 /100 | #113 | Exceptional 5.1% |
| Immigrants | Ireland | 92.1 /100 | #114 | Exceptional 5.1% |
| Immigrants | Western Europe | 91.1 /100 | #115 | Exceptional 5.1% |
| Immigrants | Sri Lanka | 91.1 /100 | #116 | Exceptional 5.1% |
| Immigrants | Malaysia | 91.0 /100 | #117 | Exceptional 5.1% |
| Immigrants | Germany | 90.8 /100 | #118 | Exceptional 5.1% |
| Immigrants | France | 89.7 /100 | #119 | Excellent 5.1% |
Demographics Similar to Comanche by Unemployment
In terms of unemployment, the demographic groups most similar to Comanche are Immigrants from Africa (5.5%, a difference of 0.0%), Immigrants from Syria (5.5%, a difference of 0.050%), Panamanian (5.5%, a difference of 0.080%), Hawaiian (5.5%, a difference of 0.13%), and Ottawa (5.5%, a difference of 0.13%).
| Demographics | Rating | Rank | Unemployment |
| South American Indians | 7.8 /100 | #225 | Tragic 5.5% |
| Samoans | 7.1 /100 | #226 | Tragic 5.5% |
| Immigrants | Lebanon | 7.0 /100 | #227 | Tragic 5.5% |
| Guamanians/Chamorros | 6.3 /100 | #228 | Tragic 5.5% |
| Hawaiians | 5.4 /100 | #229 | Tragic 5.5% |
| Ottawa | 5.4 /100 | #230 | Tragic 5.5% |
| Immigrants | Africa | 4.9 /100 | #231 | Tragic 5.5% |
| Comanche | 4.9 /100 | #232 | Tragic 5.5% |
| Immigrants | Syria | 4.8 /100 | #233 | Tragic 5.5% |
| Panamanians | 4.7 /100 | #234 | Tragic 5.5% |
| Immigrants | Panama | 3.4 /100 | #235 | Tragic 5.5% |
| Immigrants | Cambodia | 3.3 /100 | #236 | Tragic 5.5% |
| Moroccans | 3.2 /100 | #237 | Tragic 5.5% |
| Immigrants | Western Asia | 2.8 /100 | #238 | Tragic 5.5% |
| Immigrants | Immigrants | 2.6 /100 | #239 | Tragic 5.5% |