Slovene vs Italian Disability Age 65 to 74
COMPARE
Slovene
Italian
Disability Age 65 to 74
Disability Age 65 to 74 Comparison
Slovenes
Italians
22.2%
DISABILITY AGE 65 TO 74
96.1/ 100
METRIC RATING
107th/ 347
METRIC RANK
22.0%
DISABILITY AGE 65 TO 74
97.9/ 100
METRIC RATING
90th/ 347
METRIC RANK
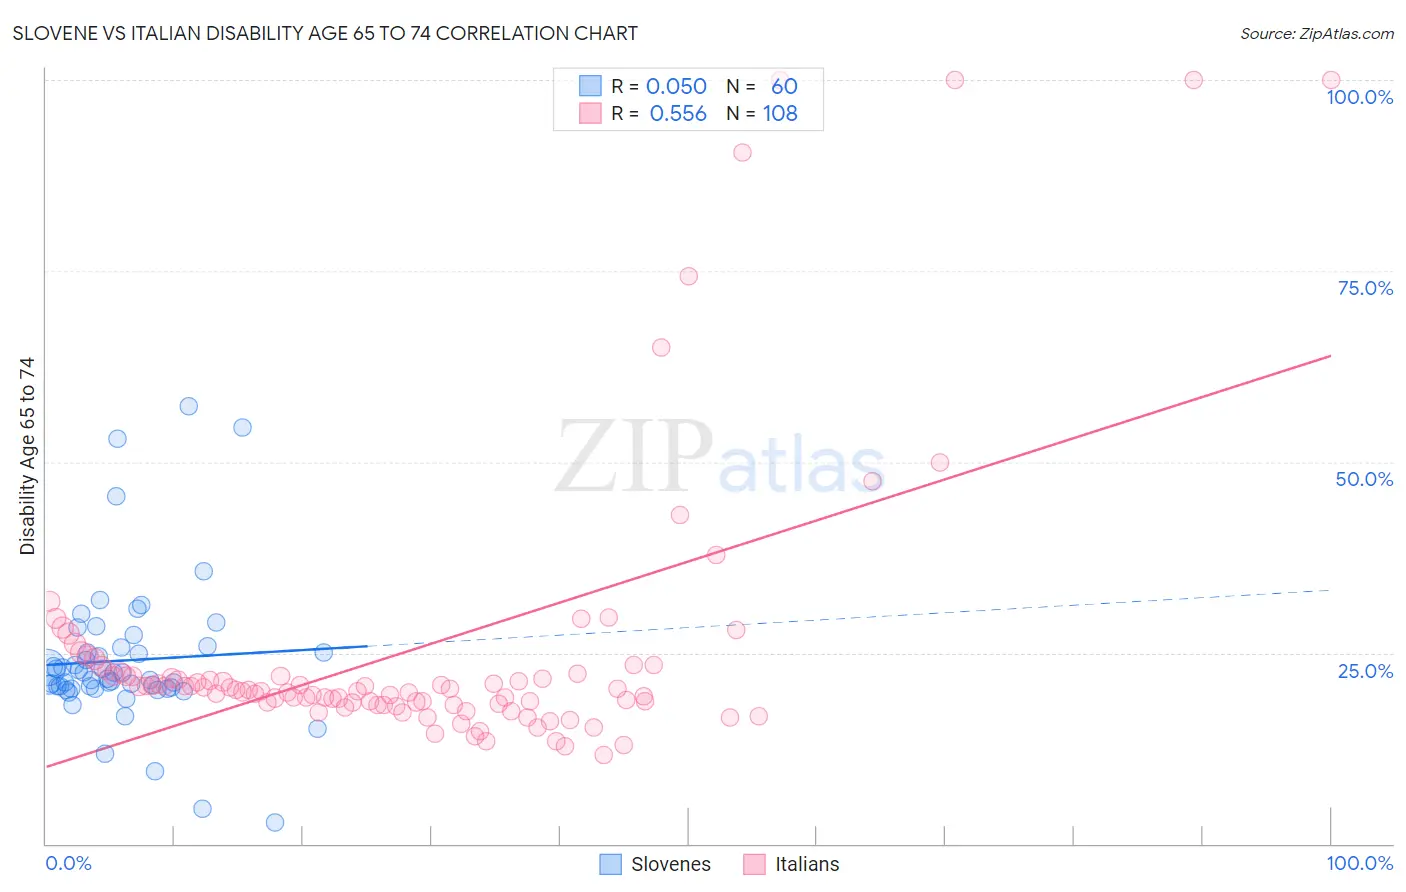
Slovene vs Italian Disability Age 65 to 74 Correlation Chart
The statistical analysis conducted on geographies consisting of 261,130,242 people shows a slight positive correlation between the proportion of Slovenes and percentage of population with a disability between the ages 65 and 75 in the United States with a correlation coefficient (R) of 0.050 and weighted average of 22.2%. Similarly, the statistical analysis conducted on geographies consisting of 572,372,600 people shows a substantial positive correlation between the proportion of Italians and percentage of population with a disability between the ages 65 and 75 in the United States with a correlation coefficient (R) of 0.556 and weighted average of 22.0%, a difference of 1.0%.
Disability Age 65 to 74 Correlation Summary
| Measurement | Slovene | Italian |
| Minimum | 2.8% | 11.6% |
| Maximum | 57.2% | 100.0% |
| Range | 54.5% | 88.4% |
| Mean | 24.0% | 25.4% |
| Median | 22.0% | 20.2% |
| Interquartile 25% (IQ1) | 20.4% | 18.3% |
| Interquartile 75% (IQ3) | 25.4% | 22.3% |
| Interquartile Range (IQR) | 5.0% | 4.0% |
| Standard Deviation (Sample) | 9.6% | 18.4% |
| Standard Deviation (Population) | 9.5% | 18.3% |
Demographics Similar to Slovenes and Italians by Disability Age 65 to 74
In terms of disability age 65 to 74, the demographic groups most similar to Slovenes are Peruvian (22.2%, a difference of 0.010%), Immigrants from Zimbabwe (22.3%, a difference of 0.010%), Palestinian (22.2%, a difference of 0.070%), Colombian (22.2%, a difference of 0.11%), and South American (22.2%, a difference of 0.12%). Similarly, the demographic groups most similar to Italians are Immigrants from Kuwait (22.0%, a difference of 0.010%), Immigrants from Netherlands (22.0%, a difference of 0.020%), Chilean (22.0%, a difference of 0.020%), Polish (22.0%, a difference of 0.070%), and Immigrants from Canada (22.1%, a difference of 0.10%).
| Demographics | Rating | Rank | Disability Age 65 to 74 |
| Immigrants | Netherlands | 97.9 /100 | #88 | Exceptional 22.0% |
| Immigrants | Kuwait | 97.9 /100 | #89 | Exceptional 22.0% |
| Italians | 97.9 /100 | #90 | Exceptional 22.0% |
| Chileans | 97.9 /100 | #91 | Exceptional 22.0% |
| Poles | 97.8 /100 | #92 | Exceptional 22.0% |
| Immigrants | Canada | 97.8 /100 | #93 | Exceptional 22.1% |
| Immigrants | Chile | 97.7 /100 | #94 | Exceptional 22.1% |
| Romanians | 97.7 /100 | #95 | Exceptional 22.1% |
| Immigrants | North America | 97.5 /100 | #96 | Exceptional 22.1% |
| Immigrants | Southern Europe | 97.2 /100 | #97 | Exceptional 22.1% |
| Jordanians | 96.9 /100 | #98 | Exceptional 22.2% |
| Immigrants | Colombia | 96.8 /100 | #99 | Exceptional 22.2% |
| Uruguayans | 96.5 /100 | #100 | Exceptional 22.2% |
| Immigrants | England | 96.5 /100 | #101 | Exceptional 22.2% |
| Immigrants | Saudi Arabia | 96.4 /100 | #102 | Exceptional 22.2% |
| South Americans | 96.4 /100 | #103 | Exceptional 22.2% |
| Colombians | 96.4 /100 | #104 | Exceptional 22.2% |
| Palestinians | 96.3 /100 | #105 | Exceptional 22.2% |
| Peruvians | 96.1 /100 | #106 | Exceptional 22.2% |
| Slovenes | 96.1 /100 | #107 | Exceptional 22.2% |
| Immigrants | Zimbabwe | 96.1 /100 | #108 | Exceptional 22.3% |