Slavic vs Tsimshian Cognitive Disability
COMPARE
Slavic
Tsimshian
Cognitive Disability
Cognitive Disability Comparison
Slavs
Tsimshian
16.7%
COGNITIVE DISABILITY
99.3/ 100
METRIC RATING
74th/ 347
METRIC RANK
17.3%
COGNITIVE DISABILITY
49.8/ 100
METRIC RATING
175th/ 347
METRIC RANK
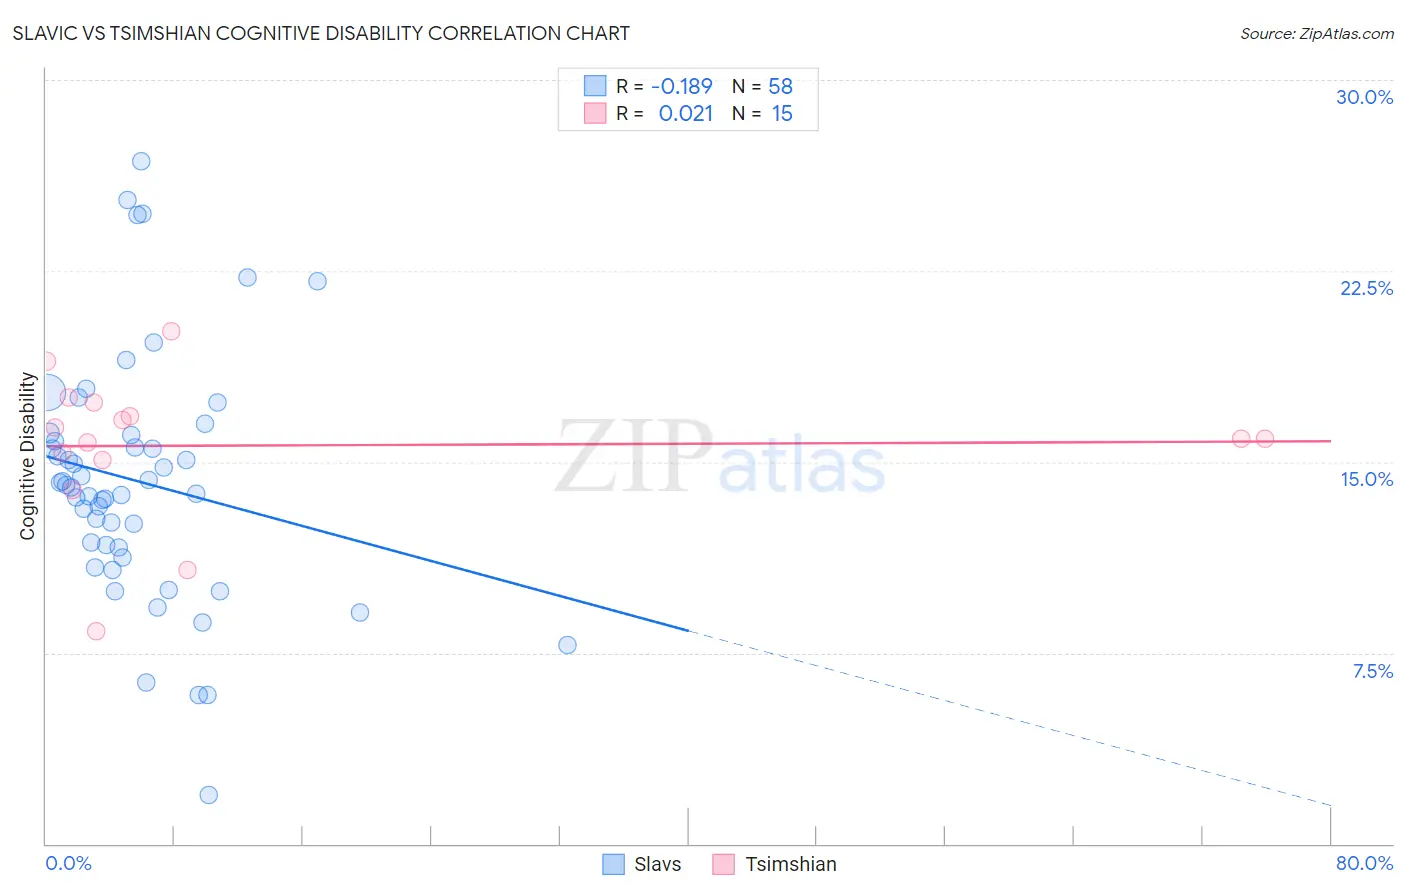
Slavic vs Tsimshian Cognitive Disability Correlation Chart
The statistical analysis conducted on geographies consisting of 270,861,069 people shows a poor negative correlation between the proportion of Slavs and percentage of population with cognitive disability in the United States with a correlation coefficient (R) of -0.189 and weighted average of 16.7%. Similarly, the statistical analysis conducted on geographies consisting of 15,626,544 people shows no correlation between the proportion of Tsimshian and percentage of population with cognitive disability in the United States with a correlation coefficient (R) of 0.021 and weighted average of 17.3%, a difference of 3.7%.
Cognitive Disability Correlation Summary
| Measurement | Slavic | Tsimshian |
| Minimum | 1.9% | 8.4% |
| Maximum | 26.8% | 20.1% |
| Range | 24.9% | 11.8% |
| Mean | 14.2% | 15.6% |
| Median | 14.0% | 15.9% |
| Interquartile 25% (IQ1) | 11.6% | 15.1% |
| Interquartile 75% (IQ3) | 16.0% | 17.3% |
| Interquartile Range (IQR) | 4.4% | 2.3% |
| Standard Deviation (Sample) | 4.9% | 2.9% |
| Standard Deviation (Population) | 4.8% | 2.8% |
Similar Demographics by Cognitive Disability
Demographics Similar to Slavs by Cognitive Disability
In terms of cognitive disability, the demographic groups most similar to Slavs are Burmese (16.7%, a difference of 0.0%), German (16.7%, a difference of 0.010%), Estonian (16.7%, a difference of 0.010%), Immigrants from Sweden (16.7%, a difference of 0.030%), and Immigrants from Belgium (16.7%, a difference of 0.030%).
| Demographics | Rating | Rank | Cognitive Disability |
| Latvians | 99.5 /100 | #67 | Exceptional 16.6% |
| Ukrainians | 99.4 /100 | #68 | Exceptional 16.6% |
| Immigrants | Uzbekistan | 99.4 /100 | #69 | Exceptional 16.7% |
| Immigrants | Sweden | 99.4 /100 | #70 | Exceptional 16.7% |
| Immigrants | Belgium | 99.3 /100 | #71 | Exceptional 16.7% |
| Germans | 99.3 /100 | #72 | Exceptional 16.7% |
| Burmese | 99.3 /100 | #73 | Exceptional 16.7% |
| Slavs | 99.3 /100 | #74 | Exceptional 16.7% |
| Estonians | 99.3 /100 | #75 | Exceptional 16.7% |
| Immigrants | Serbia | 99.3 /100 | #76 | Exceptional 16.7% |
| Immigrants | Hungary | 99.3 /100 | #77 | Exceptional 16.7% |
| Peruvians | 99.3 /100 | #78 | Exceptional 16.7% |
| Immigrants | Bulgaria | 99.3 /100 | #79 | Exceptional 16.7% |
| Egyptians | 99.2 /100 | #80 | Exceptional 16.7% |
| Immigrants | Netherlands | 99.2 /100 | #81 | Exceptional 16.7% |
Demographics Similar to Tsimshian by Cognitive Disability
In terms of cognitive disability, the demographic groups most similar to Tsimshian are Immigrants from Northern Africa (17.3%, a difference of 0.010%), Laotian (17.3%, a difference of 0.010%), Shoshone (17.3%, a difference of 0.020%), Ute (17.3%, a difference of 0.020%), and Spanish (17.3%, a difference of 0.020%).
| Demographics | Rating | Rank | Cognitive Disability |
| Immigrants | Immigrants | 62.5 /100 | #168 | Good 17.2% |
| Immigrants | Portugal | 61.8 /100 | #169 | Good 17.2% |
| Ecuadorians | 59.6 /100 | #170 | Average 17.2% |
| Tlingit-Haida | 59.4 /100 | #171 | Average 17.2% |
| Immigrants | Turkey | 56.7 /100 | #172 | Average 17.2% |
| Immigrants | Northern Africa | 50.2 /100 | #173 | Average 17.3% |
| Laotians | 50.0 /100 | #174 | Average 17.3% |
| Tsimshian | 49.8 /100 | #175 | Average 17.3% |
| Shoshone | 49.2 /100 | #176 | Average 17.3% |
| Ute | 49.1 /100 | #177 | Average 17.3% |
| Spanish | 48.9 /100 | #178 | Average 17.3% |
| Sioux | 48.6 /100 | #179 | Average 17.3% |
| Pakistanis | 43.9 /100 | #180 | Average 17.3% |
| Immigrants | Guyana | 42.9 /100 | #181 | Average 17.3% |
| Arabs | 42.8 /100 | #182 | Average 17.3% |