Slavic vs Immigrants from Nicaragua Cognitive Disability
COMPARE
Slavic
Immigrants from Nicaragua
Cognitive Disability
Cognitive Disability Comparison
Slavs
Immigrants from Nicaragua
16.7%
COGNITIVE DISABILITY
99.3/ 100
METRIC RATING
74th/ 347
METRIC RANK
16.8%
COGNITIVE DISABILITY
97.8/ 100
METRIC RATING
107th/ 347
METRIC RANK
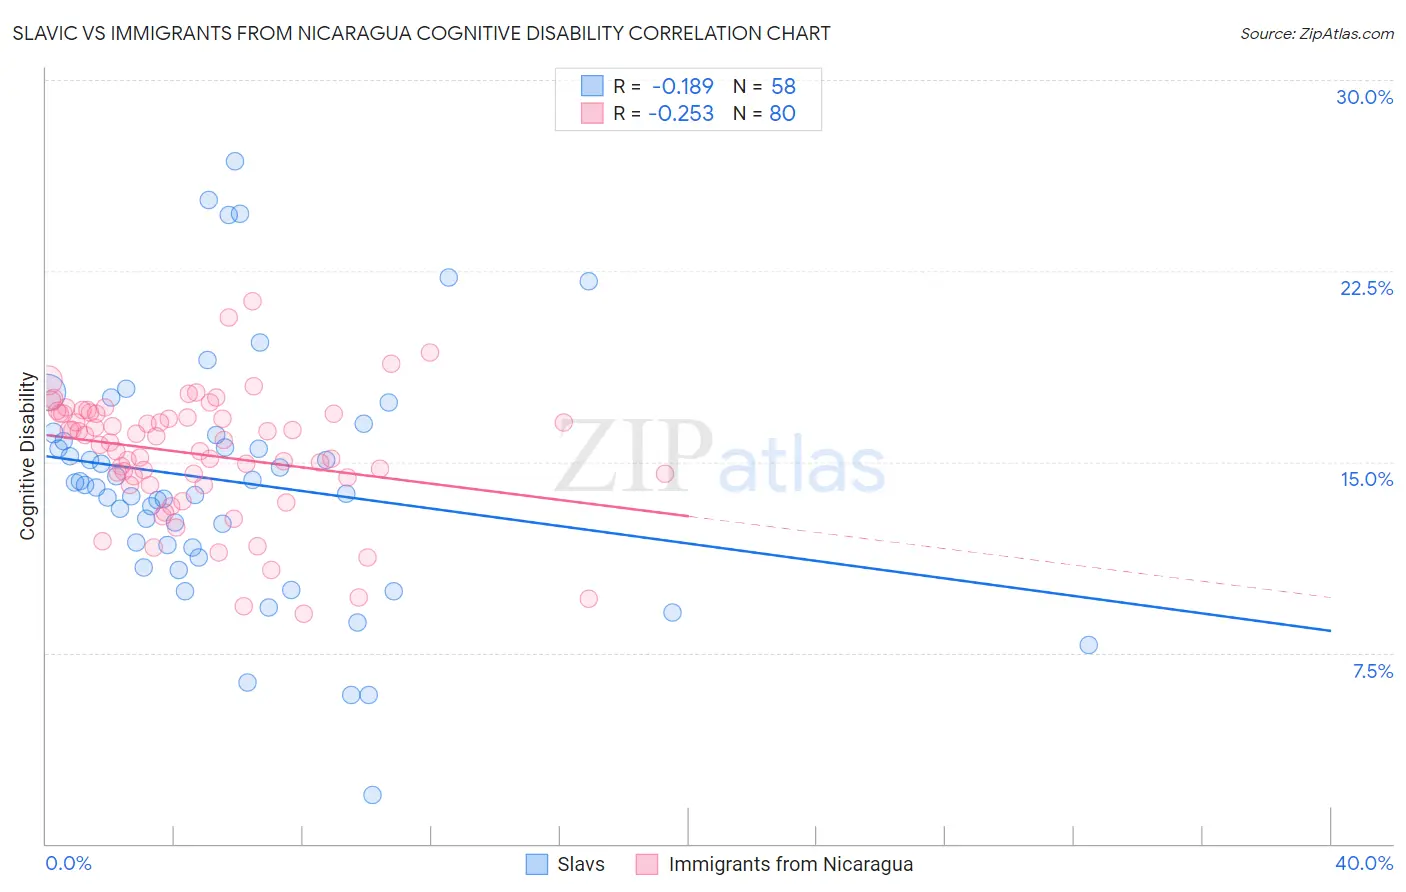
Slavic vs Immigrants from Nicaragua Cognitive Disability Correlation Chart
The statistical analysis conducted on geographies consisting of 270,861,069 people shows a poor negative correlation between the proportion of Slavs and percentage of population with cognitive disability in the United States with a correlation coefficient (R) of -0.189 and weighted average of 16.7%. Similarly, the statistical analysis conducted on geographies consisting of 236,326,974 people shows a weak negative correlation between the proportion of Immigrants from Nicaragua and percentage of population with cognitive disability in the United States with a correlation coefficient (R) of -0.253 and weighted average of 16.8%, a difference of 0.89%.
Cognitive Disability Correlation Summary
| Measurement | Slavic | Immigrants from Nicaragua |
| Minimum | 1.9% | 9.1% |
| Maximum | 26.8% | 21.3% |
| Range | 24.9% | 12.2% |
| Mean | 14.2% | 15.3% |
| Median | 14.0% | 15.8% |
| Interquartile 25% (IQ1) | 11.6% | 14.2% |
| Interquartile 75% (IQ3) | 16.0% | 16.9% |
| Interquartile Range (IQR) | 4.4% | 2.7% |
| Standard Deviation (Sample) | 4.9% | 2.4% |
| Standard Deviation (Population) | 4.8% | 2.4% |
Similar Demographics by Cognitive Disability
Demographics Similar to Slavs by Cognitive Disability
In terms of cognitive disability, the demographic groups most similar to Slavs are Burmese (16.7%, a difference of 0.0%), German (16.7%, a difference of 0.010%), Estonian (16.7%, a difference of 0.010%), Immigrants from Sweden (16.7%, a difference of 0.030%), and Immigrants from Belgium (16.7%, a difference of 0.030%).
| Demographics | Rating | Rank | Cognitive Disability |
| Latvians | 99.5 /100 | #67 | Exceptional 16.6% |
| Ukrainians | 99.4 /100 | #68 | Exceptional 16.6% |
| Immigrants | Uzbekistan | 99.4 /100 | #69 | Exceptional 16.7% |
| Immigrants | Sweden | 99.4 /100 | #70 | Exceptional 16.7% |
| Immigrants | Belgium | 99.3 /100 | #71 | Exceptional 16.7% |
| Germans | 99.3 /100 | #72 | Exceptional 16.7% |
| Burmese | 99.3 /100 | #73 | Exceptional 16.7% |
| Slavs | 99.3 /100 | #74 | Exceptional 16.7% |
| Estonians | 99.3 /100 | #75 | Exceptional 16.7% |
| Immigrants | Serbia | 99.3 /100 | #76 | Exceptional 16.7% |
| Immigrants | Hungary | 99.3 /100 | #77 | Exceptional 16.7% |
| Peruvians | 99.3 /100 | #78 | Exceptional 16.7% |
| Immigrants | Bulgaria | 99.3 /100 | #79 | Exceptional 16.7% |
| Egyptians | 99.2 /100 | #80 | Exceptional 16.7% |
| Immigrants | Netherlands | 99.2 /100 | #81 | Exceptional 16.7% |
Demographics Similar to Immigrants from Nicaragua by Cognitive Disability
In terms of cognitive disability, the demographic groups most similar to Immigrants from Nicaragua are Northern European (16.8%, a difference of 0.020%), Immigrants from Eastern Asia (16.8%, a difference of 0.060%), Paraguayan (16.8%, a difference of 0.070%), Palestinian (16.8%, a difference of 0.070%), and Canadian (16.8%, a difference of 0.090%).
| Demographics | Rating | Rank | Cognitive Disability |
| Immigrants | Russia | 98.2 /100 | #100 | Exceptional 16.8% |
| Immigrants | Asia | 98.1 /100 | #101 | Exceptional 16.8% |
| Irish | 98.1 /100 | #102 | Exceptional 16.8% |
| Paraguayans | 98.0 /100 | #103 | Exceptional 16.8% |
| Palestinians | 98.0 /100 | #104 | Exceptional 16.8% |
| Immigrants | Eastern Asia | 97.9 /100 | #105 | Exceptional 16.8% |
| Northern Europeans | 97.8 /100 | #106 | Exceptional 16.8% |
| Immigrants | Nicaragua | 97.8 /100 | #107 | Exceptional 16.8% |
| Canadians | 97.5 /100 | #108 | Exceptional 16.8% |
| Albanians | 97.3 /100 | #109 | Exceptional 16.8% |
| Arapaho | 97.3 /100 | #110 | Exceptional 16.8% |
| Uruguayans | 97.2 /100 | #111 | Exceptional 16.8% |
| Indians (Asian) | 97.2 /100 | #112 | Exceptional 16.8% |
| Immigrants | Sri Lanka | 97.1 /100 | #113 | Exceptional 16.8% |
| Koreans | 97.1 /100 | #114 | Exceptional 16.8% |