Slavic vs Choctaw Disability Age 18 to 34
COMPARE
Slavic
Choctaw
Disability Age 18 to 34
Disability Age 18 to 34 Comparison
Slavs
Choctaw
7.4%
DISABILITY AGE 18 TO 34
0.1/ 100
METRIC RATING
273rd/ 347
METRIC RANK
9.0%
DISABILITY AGE 18 TO 34
0.0/ 100
METRIC RATING
340th/ 347
METRIC RANK
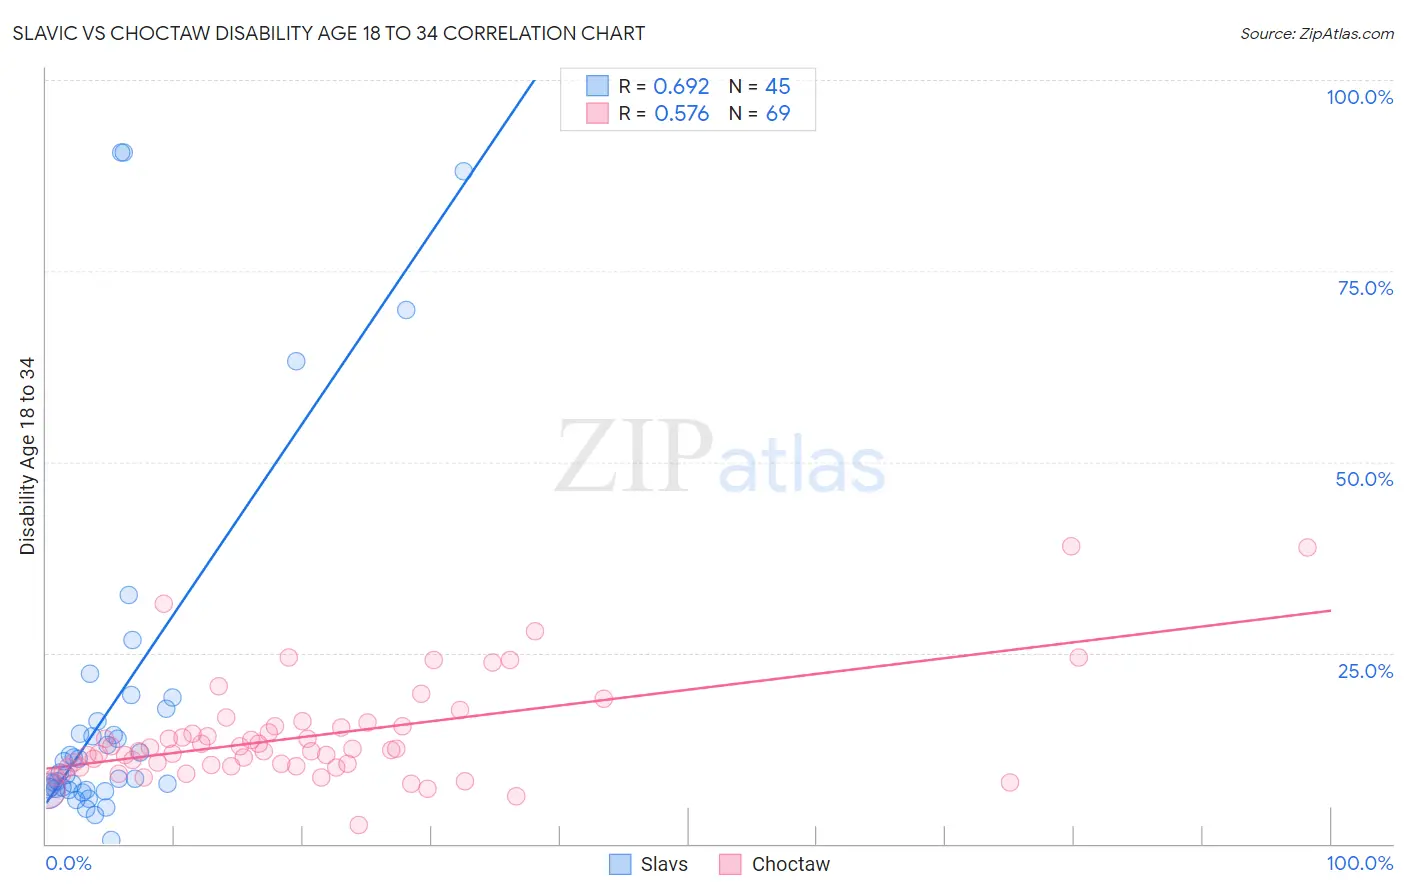
Slavic vs Choctaw Disability Age 18 to 34 Correlation Chart
The statistical analysis conducted on geographies consisting of 270,473,270 people shows a significant positive correlation between the proportion of Slavs and percentage of population with a disability between the ages 18 and 35 in the United States with a correlation coefficient (R) of 0.692 and weighted average of 7.4%. Similarly, the statistical analysis conducted on geographies consisting of 269,208,215 people shows a substantial positive correlation between the proportion of Choctaw and percentage of population with a disability between the ages 18 and 35 in the United States with a correlation coefficient (R) of 0.576 and weighted average of 9.0%, a difference of 21.2%.
Disability Age 18 to 34 Correlation Summary
| Measurement | Slavic | Choctaw |
| Minimum | 0.47% | 2.4% |
| Maximum | 90.5% | 38.9% |
| Range | 90.0% | 36.5% |
| Mean | 18.6% | 14.1% |
| Median | 9.3% | 12.2% |
| Interquartile 25% (IQ1) | 7.2% | 10.2% |
| Interquartile 75% (IQ3) | 16.9% | 15.4% |
| Interquartile Range (IQR) | 9.7% | 5.2% |
| Standard Deviation (Sample) | 23.2% | 6.8% |
| Standard Deviation (Population) | 23.0% | 6.7% |
Similar Demographics by Disability Age 18 to 34
Demographics Similar to Slavs by Disability Age 18 to 34
In terms of disability age 18 to 34, the demographic groups most similar to Slavs are African (7.4%, a difference of 0.010%), Tsimshian (7.4%, a difference of 0.050%), Immigrants from Somalia (7.4%, a difference of 0.080%), European (7.4%, a difference of 0.13%), and Swiss (7.4%, a difference of 0.14%).
| Demographics | Rating | Rank | Disability Age 18 to 34 |
| German Russians | 0.1 /100 | #266 | Tragic 7.4% |
| Bangladeshis | 0.1 /100 | #267 | Tragic 7.4% |
| Portuguese | 0.1 /100 | #268 | Tragic 7.4% |
| Basques | 0.1 /100 | #269 | Tragic 7.4% |
| Belgians | 0.1 /100 | #270 | Tragic 7.4% |
| Swiss | 0.1 /100 | #271 | Tragic 7.4% |
| Tsimshian | 0.1 /100 | #272 | Tragic 7.4% |
| Slavs | 0.1 /100 | #273 | Tragic 7.4% |
| Africans | 0.1 /100 | #274 | Tragic 7.4% |
| Immigrants | Somalia | 0.1 /100 | #275 | Tragic 7.4% |
| Europeans | 0.1 /100 | #276 | Tragic 7.4% |
| Immigrants | Portugal | 0.1 /100 | #277 | Tragic 7.4% |
| Lumbee | 0.1 /100 | #278 | Tragic 7.4% |
| Czechoslovakians | 0.1 /100 | #279 | Tragic 7.4% |
| Yaqui | 0.1 /100 | #280 | Tragic 7.4% |
Demographics Similar to Choctaw by Disability Age 18 to 34
In terms of disability age 18 to 34, the demographic groups most similar to Choctaw are Chickasaw (9.0%, a difference of 0.080%), Yakama (9.0%, a difference of 0.14%), Chippewa (9.0%, a difference of 0.15%), Creek (9.0%, a difference of 0.53%), and Kiowa (8.8%, a difference of 1.5%).
| Demographics | Rating | Rank | Disability Age 18 to 34 |
| Apache | 0.0 /100 | #333 | Tragic 8.4% |
| Dutch West Indians | 0.0 /100 | #334 | Tragic 8.4% |
| Seminole | 0.0 /100 | #335 | Tragic 8.4% |
| Immigrants | Azores | 0.0 /100 | #336 | Tragic 8.5% |
| Ottawa | 0.0 /100 | #337 | Tragic 8.6% |
| Cherokee | 0.0 /100 | #338 | Tragic 8.7% |
| Kiowa | 0.0 /100 | #339 | Tragic 8.8% |
| Choctaw | 0.0 /100 | #340 | Tragic 9.0% |
| Chickasaw | 0.0 /100 | #341 | Tragic 9.0% |
| Yakama | 0.0 /100 | #342 | Tragic 9.0% |
| Chippewa | 0.0 /100 | #343 | Tragic 9.0% |
| Creek | 0.0 /100 | #344 | Tragic 9.0% |
| Alaskan Athabascans | 0.0 /100 | #345 | Tragic 9.4% |
| Houma | 0.0 /100 | #346 | Tragic 9.7% |
| Yuman | 0.0 /100 | #347 | Tragic 10.6% |