Immigrants from South America vs U.S. Virgin Islander Disability Age 18 to 34
COMPARE
Immigrants from South America
U.S. Virgin Islander
Disability Age 18 to 34
Disability Age 18 to 34 Comparison
Immigrants from South America
U.S. Virgin Islanders
5.8%
DISABILITY AGE 18 TO 34
99.9/ 100
METRIC RATING
38th/ 347
METRIC RANK
6.7%
DISABILITY AGE 18 TO 34
38.6/ 100
METRIC RATING
182nd/ 347
METRIC RANK
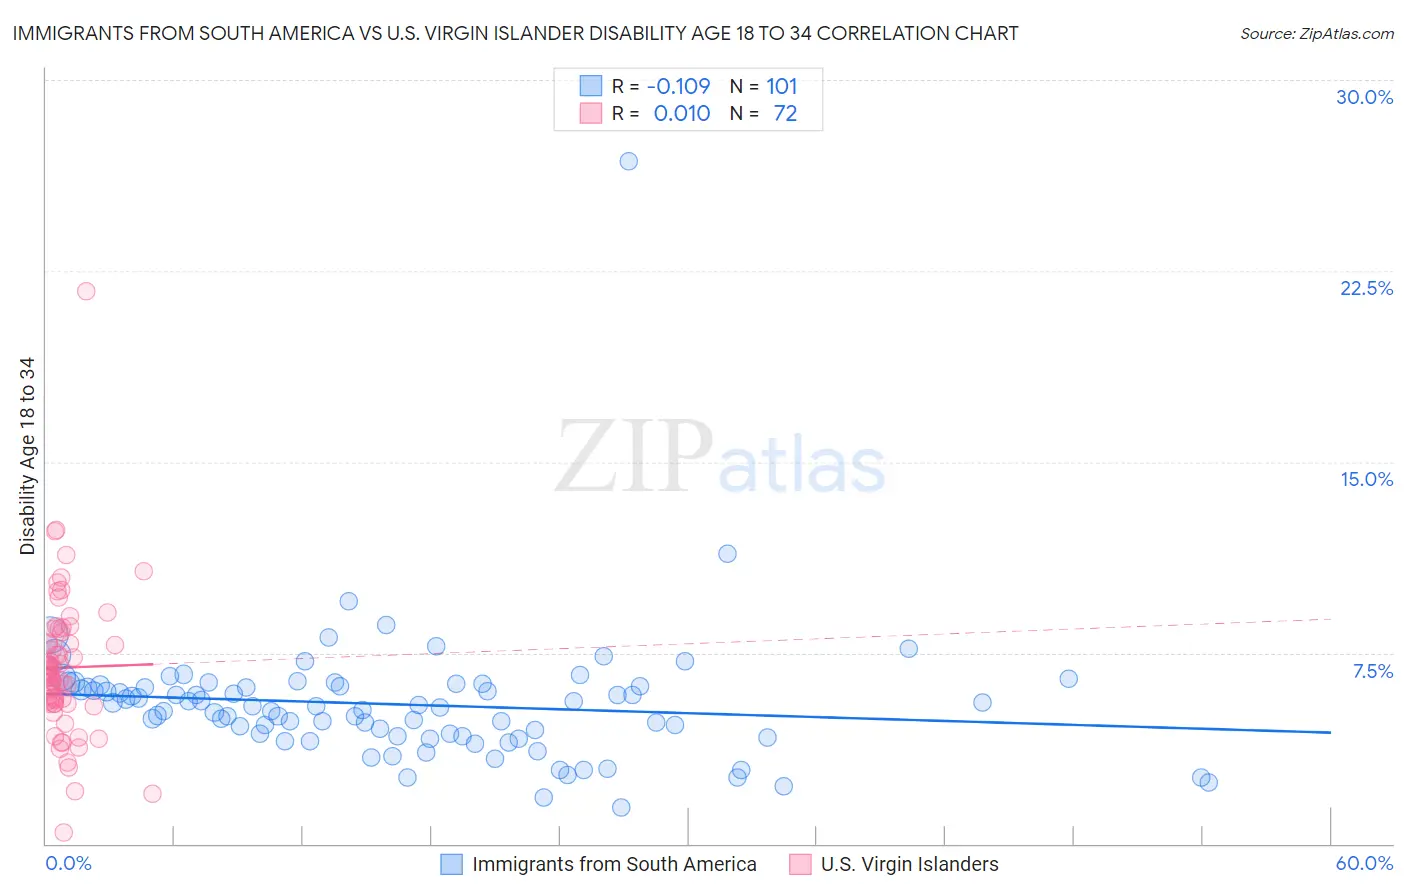
Immigrants from South America vs U.S. Virgin Islander Disability Age 18 to 34 Correlation Chart
The statistical analysis conducted on geographies consisting of 484,466,989 people shows a poor negative correlation between the proportion of Immigrants from South America and percentage of population with a disability between the ages 18 and 35 in the United States with a correlation coefficient (R) of -0.109 and weighted average of 5.8%. Similarly, the statistical analysis conducted on geographies consisting of 87,509,412 people shows no correlation between the proportion of U.S. Virgin Islanders and percentage of population with a disability between the ages 18 and 35 in the United States with a correlation coefficient (R) of 0.010 and weighted average of 6.7%, a difference of 14.5%.
Disability Age 18 to 34 Correlation Summary
| Measurement | Immigrants from South America | U.S. Virgin Islander |
| Minimum | 1.4% | 0.43% |
| Maximum | 26.8% | 21.7% |
| Range | 25.4% | 21.3% |
| Mean | 5.5% | 6.9% |
| Median | 5.4% | 6.7% |
| Interquartile 25% (IQ1) | 4.2% | 5.5% |
| Interquartile 75% (IQ3) | 6.2% | 8.1% |
| Interquartile Range (IQR) | 2.0% | 2.6% |
| Standard Deviation (Sample) | 2.7% | 2.9% |
| Standard Deviation (Population) | 2.7% | 2.9% |
Similar Demographics by Disability Age 18 to 34
Demographics Similar to Immigrants from South America by Disability Age 18 to 34
In terms of disability age 18 to 34, the demographic groups most similar to Immigrants from South America are Armenian (5.8%, a difference of 0.020%), Ecuadorian (5.8%, a difference of 0.11%), Immigrants from Lithuania (5.8%, a difference of 0.27%), Asian (5.8%, a difference of 0.30%), and Bolivian (5.8%, a difference of 0.38%).
| Demographics | Rating | Rank | Disability Age 18 to 34 |
| Iranians | 99.9 /100 | #31 | Exceptional 5.8% |
| Immigrants | Barbados | 99.9 /100 | #32 | Exceptional 5.8% |
| Argentineans | 99.9 /100 | #33 | Exceptional 5.8% |
| Venezuelans | 99.9 /100 | #34 | Exceptional 5.8% |
| Immigrants | Lithuania | 99.9 /100 | #35 | Exceptional 5.8% |
| Ecuadorians | 99.9 /100 | #36 | Exceptional 5.8% |
| Armenians | 99.9 /100 | #37 | Exceptional 5.8% |
| Immigrants | South America | 99.9 /100 | #38 | Exceptional 5.8% |
| Asians | 99.9 /100 | #39 | Exceptional 5.8% |
| Bolivians | 99.9 /100 | #40 | Exceptional 5.8% |
| Nicaraguans | 99.9 /100 | #41 | Exceptional 5.8% |
| Colombians | 99.8 /100 | #42 | Exceptional 5.9% |
| South Americans | 99.8 /100 | #43 | Exceptional 5.9% |
| Immigrants | Asia | 99.8 /100 | #44 | Exceptional 5.9% |
| Immigrants | Peru | 99.8 /100 | #45 | Exceptional 5.9% |
Demographics Similar to U.S. Virgin Islanders by Disability Age 18 to 34
In terms of disability age 18 to 34, the demographic groups most similar to U.S. Virgin Islanders are Romanian (6.6%, a difference of 0.060%), Immigrants from Austria (6.6%, a difference of 0.070%), Immigrants from Iraq (6.7%, a difference of 0.090%), Iraqi (6.7%, a difference of 0.090%), and Immigrants from Oceania (6.7%, a difference of 0.24%).
| Demographics | Rating | Rank | Disability Age 18 to 34 |
| Immigrants | Cambodia | 46.5 /100 | #175 | Average 6.6% |
| Immigrants | Africa | 45.9 /100 | #176 | Average 6.6% |
| Syrians | 44.3 /100 | #177 | Average 6.6% |
| Nigerians | 43.7 /100 | #178 | Average 6.6% |
| Immigrants | Ghana | 42.1 /100 | #179 | Average 6.6% |
| Immigrants | Austria | 39.6 /100 | #180 | Fair 6.6% |
| Romanians | 39.5 /100 | #181 | Fair 6.6% |
| U.S. Virgin Islanders | 38.6 /100 | #182 | Fair 6.7% |
| Immigrants | Iraq | 37.4 /100 | #183 | Fair 6.7% |
| Iraqis | 37.4 /100 | #184 | Fair 6.7% |
| Immigrants | Oceania | 35.4 /100 | #185 | Fair 6.7% |
| Yup'ik | 35.3 /100 | #186 | Fair 6.7% |
| Maltese | 34.8 /100 | #187 | Fair 6.7% |
| Immigrants | Cameroon | 34.5 /100 | #188 | Fair 6.7% |
| Pakistanis | 33.7 /100 | #189 | Fair 6.7% |