Slavic vs Yaqui Disability Age 18 to 34
COMPARE
Slavic
Yaqui
Disability Age 18 to 34
Disability Age 18 to 34 Comparison
Slavs
Yaqui
7.4%
DISABILITY AGE 18 TO 34
0.1/ 100
METRIC RATING
273rd/ 347
METRIC RANK
7.4%
DISABILITY AGE 18 TO 34
0.1/ 100
METRIC RATING
280th/ 347
METRIC RANK
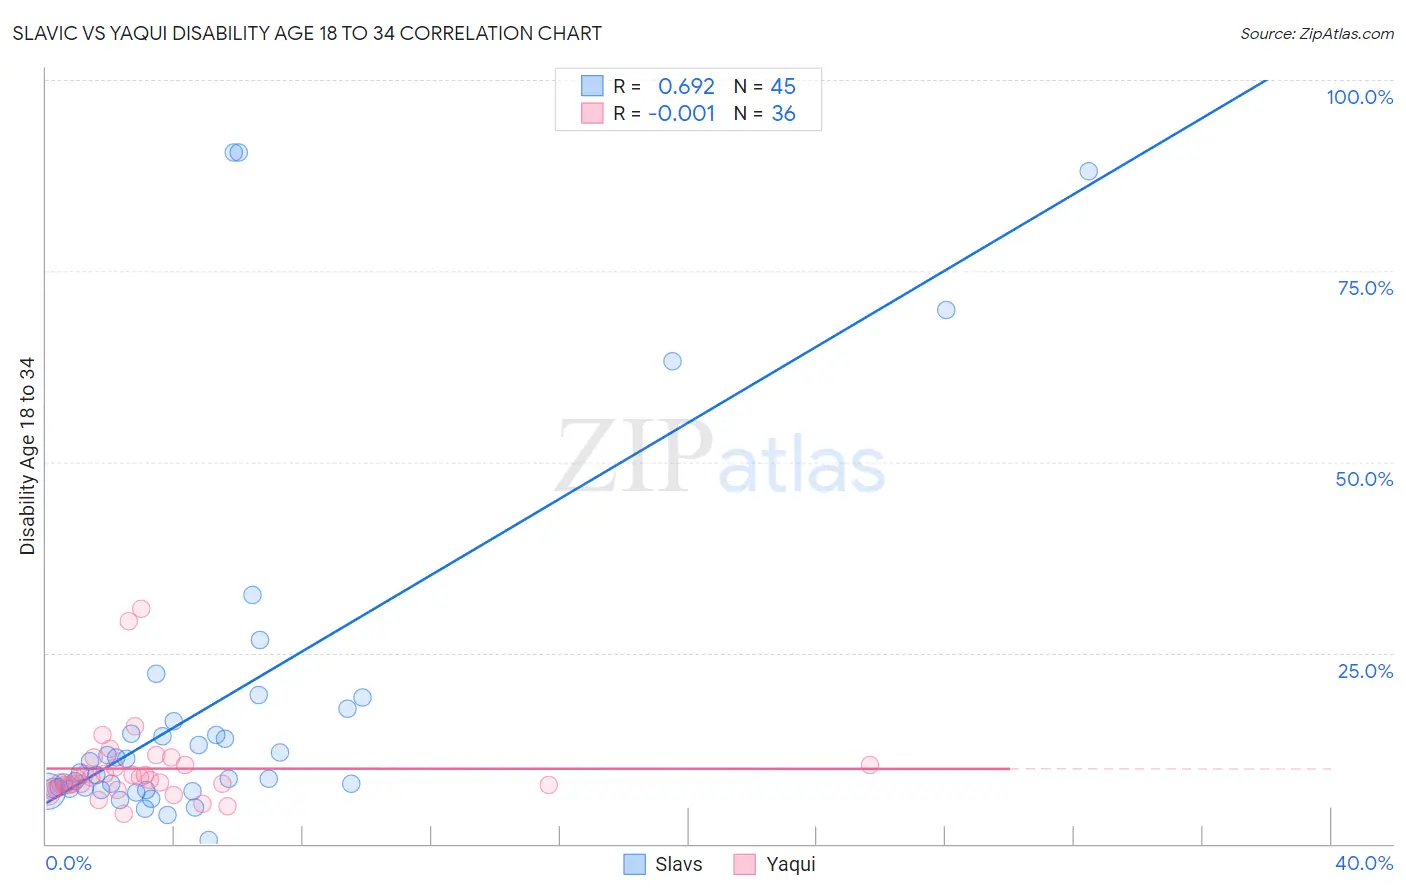
Slavic vs Yaqui Disability Age 18 to 34 Correlation Chart
The statistical analysis conducted on geographies consisting of 270,473,270 people shows a significant positive correlation between the proportion of Slavs and percentage of population with a disability between the ages 18 and 35 in the United States with a correlation coefficient (R) of 0.692 and weighted average of 7.4%. Similarly, the statistical analysis conducted on geographies consisting of 107,629,449 people shows no correlation between the proportion of Yaqui and percentage of population with a disability between the ages 18 and 35 in the United States with a correlation coefficient (R) of -0.001 and weighted average of 7.4%, a difference of 0.64%.
Disability Age 18 to 34 Correlation Summary
| Measurement | Slavic | Yaqui |
| Minimum | 0.47% | 3.9% |
| Maximum | 90.5% | 30.7% |
| Range | 90.0% | 26.8% |
| Mean | 18.6% | 9.8% |
| Median | 9.3% | 8.5% |
| Interquartile 25% (IQ1) | 7.2% | 7.4% |
| Interquartile 75% (IQ3) | 16.9% | 10.3% |
| Interquartile Range (IQR) | 9.7% | 2.9% |
| Standard Deviation (Sample) | 23.2% | 5.5% |
| Standard Deviation (Population) | 23.0% | 5.4% |
Demographics Similar to Slavs and Yaqui by Disability Age 18 to 34
In terms of disability age 18 to 34, the demographic groups most similar to Slavs are African (7.4%, a difference of 0.010%), Tsimshian (7.4%, a difference of 0.050%), Immigrants from Somalia (7.4%, a difference of 0.080%), European (7.4%, a difference of 0.13%), and Swiss (7.4%, a difference of 0.14%). Similarly, the demographic groups most similar to Yaqui are Czechoslovakian (7.4%, a difference of 0.010%), Lumbee (7.4%, a difference of 0.050%), Immigrants from Portugal (7.4%, a difference of 0.070%), Paiute (7.5%, a difference of 0.48%), and European (7.4%, a difference of 0.51%).
| Demographics | Rating | Rank | Disability Age 18 to 34 |
| German Russians | 0.1 /100 | #266 | Tragic 7.4% |
| Bangladeshis | 0.1 /100 | #267 | Tragic 7.4% |
| Portuguese | 0.1 /100 | #268 | Tragic 7.4% |
| Basques | 0.1 /100 | #269 | Tragic 7.4% |
| Belgians | 0.1 /100 | #270 | Tragic 7.4% |
| Swiss | 0.1 /100 | #271 | Tragic 7.4% |
| Tsimshian | 0.1 /100 | #272 | Tragic 7.4% |
| Slavs | 0.1 /100 | #273 | Tragic 7.4% |
| Africans | 0.1 /100 | #274 | Tragic 7.4% |
| Immigrants | Somalia | 0.1 /100 | #275 | Tragic 7.4% |
| Europeans | 0.1 /100 | #276 | Tragic 7.4% |
| Immigrants | Portugal | 0.1 /100 | #277 | Tragic 7.4% |
| Lumbee | 0.1 /100 | #278 | Tragic 7.4% |
| Czechoslovakians | 0.1 /100 | #279 | Tragic 7.4% |
| Yaqui | 0.1 /100 | #280 | Tragic 7.4% |
| Paiute | 0.0 /100 | #281 | Tragic 7.5% |
| Spanish | 0.0 /100 | #282 | Tragic 7.5% |
| Danes | 0.0 /100 | #283 | Tragic 7.5% |
| Hopi | 0.0 /100 | #284 | Tragic 7.5% |
| Swedes | 0.0 /100 | #285 | Tragic 7.5% |
| Celtics | 0.0 /100 | #286 | Tragic 7.6% |