Dutch West Indian vs Guamanian/Chamorro Disability Age 35 to 64
COMPARE
Dutch West Indian
Guamanian/Chamorro
Disability Age 35 to 64
Disability Age 35 to 64 Comparison
Dutch West Indians
Guamanians/Chamorros
15.6%
DISABILITY AGE 35 TO 64
0.0/ 100
METRIC RATING
331st/ 347
METRIC RANK
12.2%
DISABILITY AGE 35 TO 64
1.4/ 100
METRIC RATING
246th/ 347
METRIC RANK
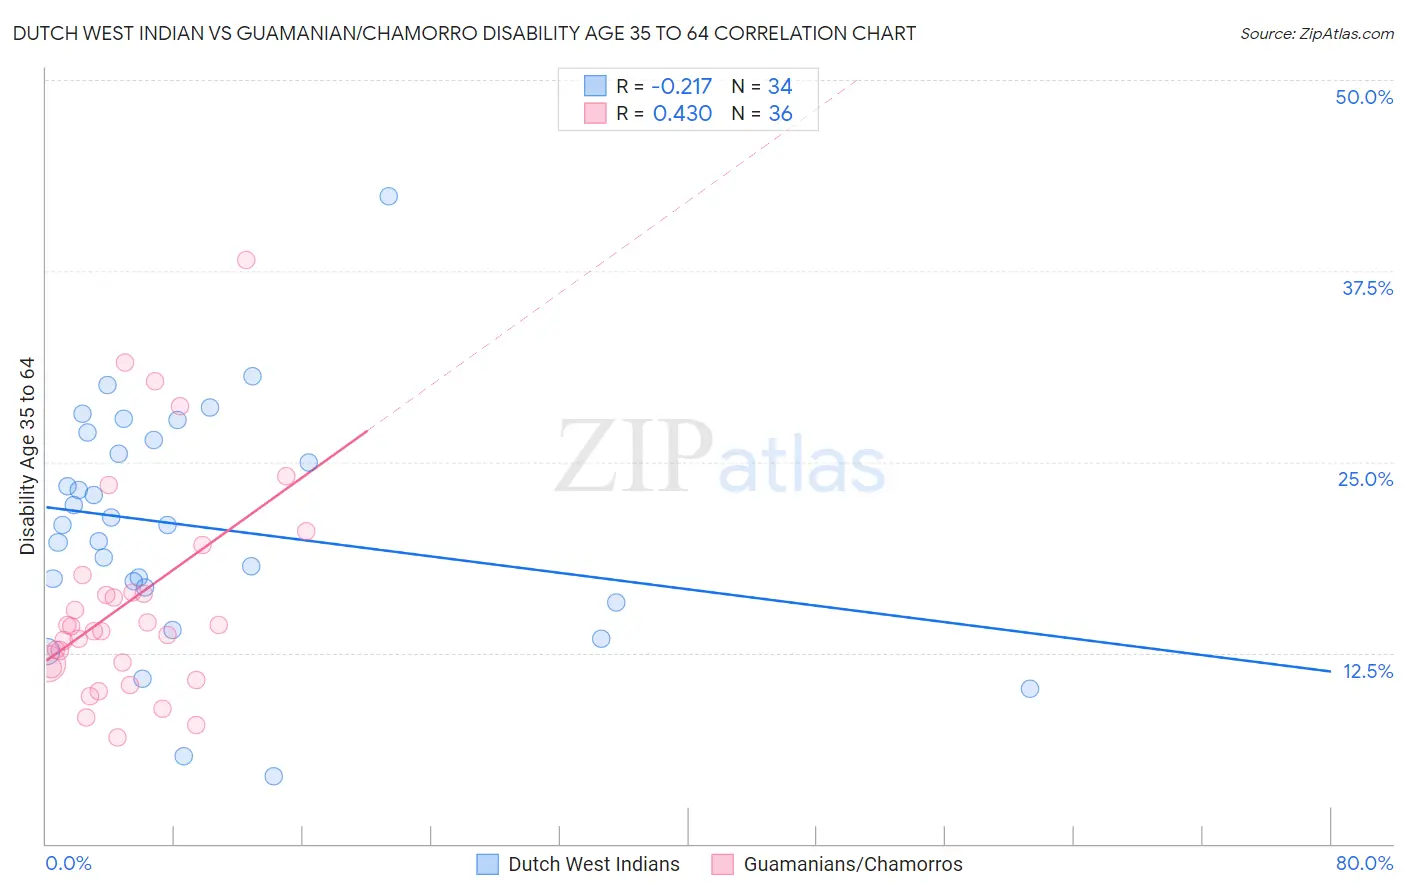
Dutch West Indian vs Guamanian/Chamorro Disability Age 35 to 64 Correlation Chart
The statistical analysis conducted on geographies consisting of 85,764,745 people shows a weak negative correlation between the proportion of Dutch West Indians and percentage of population with a disability between the ages 34 and 64 in the United States with a correlation coefficient (R) of -0.217 and weighted average of 15.6%. Similarly, the statistical analysis conducted on geographies consisting of 221,858,951 people shows a moderate positive correlation between the proportion of Guamanians/Chamorros and percentage of population with a disability between the ages 34 and 64 in the United States with a correlation coefficient (R) of 0.430 and weighted average of 12.2%, a difference of 27.7%.
Disability Age 35 to 64 Correlation Summary
| Measurement | Dutch West Indian | Guamanian/Chamorro |
| Minimum | 4.4% | 7.0% |
| Maximum | 42.4% | 38.2% |
| Range | 38.0% | 31.2% |
| Mean | 20.8% | 15.9% |
| Median | 20.9% | 14.1% |
| Interquartile 25% (IQ1) | 16.8% | 11.7% |
| Interquartile 75% (IQ3) | 26.5% | 17.0% |
| Interquartile Range (IQR) | 9.7% | 5.3% |
| Standard Deviation (Sample) | 7.7% | 7.1% |
| Standard Deviation (Population) | 7.6% | 7.0% |
Similar Demographics by Disability Age 35 to 64
Demographics Similar to Dutch West Indians by Disability Age 35 to 64
In terms of disability age 35 to 64, the demographic groups most similar to Dutch West Indians are Alaskan Athabascan (15.7%, a difference of 0.59%), Navajo (15.5%, a difference of 0.92%), Cherokee (15.5%, a difference of 1.1%), Yuman (15.8%, a difference of 1.1%), and Colville (15.8%, a difference of 1.3%).
| Demographics | Rating | Rank | Disability Age 35 to 64 |
| Chippewa | 0.0 /100 | #324 | Tragic 15.0% |
| Arapaho | 0.0 /100 | #325 | Tragic 15.1% |
| Natives/Alaskans | 0.0 /100 | #326 | Tragic 15.3% |
| Pueblo | 0.0 /100 | #327 | Tragic 15.3% |
| Cajuns | 0.0 /100 | #328 | Tragic 15.3% |
| Cherokee | 0.0 /100 | #329 | Tragic 15.5% |
| Navajo | 0.0 /100 | #330 | Tragic 15.5% |
| Dutch West Indians | 0.0 /100 | #331 | Tragic 15.6% |
| Alaskan Athabascans | 0.0 /100 | #332 | Tragic 15.7% |
| Yuman | 0.0 /100 | #333 | Tragic 15.8% |
| Colville | 0.0 /100 | #334 | Tragic 15.8% |
| Seminole | 0.0 /100 | #335 | Tragic 15.9% |
| Menominee | 0.0 /100 | #336 | Tragic 15.9% |
| Puerto Ricans | 0.0 /100 | #337 | Tragic 15.9% |
| Chickasaw | 0.0 /100 | #338 | Tragic 16.1% |
Demographics Similar to Guamanians/Chamorros by Disability Age 35 to 64
In terms of disability age 35 to 64, the demographic groups most similar to Guamanians/Chamorros are Immigrants from Senegal (12.2%, a difference of 0.040%), Spaniard (12.3%, a difference of 0.13%), Hispanic or Latino (12.3%, a difference of 0.16%), Immigrants from Burma/Myanmar (12.3%, a difference of 0.29%), and German (12.3%, a difference of 0.37%).
| Demographics | Rating | Rank | Disability Age 35 to 64 |
| Immigrants | Western Africa | 3.3 /100 | #239 | Tragic 12.0% |
| Immigrants | Thailand | 3.3 /100 | #240 | Tragic 12.0% |
| Mexican American Indians | 3.2 /100 | #241 | Tragic 12.0% |
| Samoans | 2.8 /100 | #242 | Tragic 12.1% |
| Slovaks | 2.7 /100 | #243 | Tragic 12.1% |
| Finns | 2.3 /100 | #244 | Tragic 12.1% |
| Immigrants | Mexico | 2.2 /100 | #245 | Tragic 12.1% |
| Guamanians/Chamorros | 1.4 /100 | #246 | Tragic 12.2% |
| Immigrants | Senegal | 1.3 /100 | #247 | Tragic 12.2% |
| Spaniards | 1.3 /100 | #248 | Tragic 12.3% |
| Hispanics or Latinos | 1.3 /100 | #249 | Tragic 12.3% |
| Immigrants | Burma/Myanmar | 1.2 /100 | #250 | Tragic 12.3% |
| Germans | 1.1 /100 | #251 | Tragic 12.3% |
| Irish | 1.0 /100 | #252 | Tragic 12.3% |
| Dutch | 1.0 /100 | #253 | Tragic 12.3% |