Scandinavian vs Guamanian/Chamorro Disability Age 35 to 64
COMPARE
Scandinavian
Guamanian/Chamorro
Disability Age 35 to 64
Disability Age 35 to 64 Comparison
Scandinavians
Guamanians/Chamorros
11.9%
DISABILITY AGE 35 TO 64
6.4/ 100
METRIC RATING
226th/ 347
METRIC RANK
12.2%
DISABILITY AGE 35 TO 64
1.4/ 100
METRIC RATING
246th/ 347
METRIC RANK
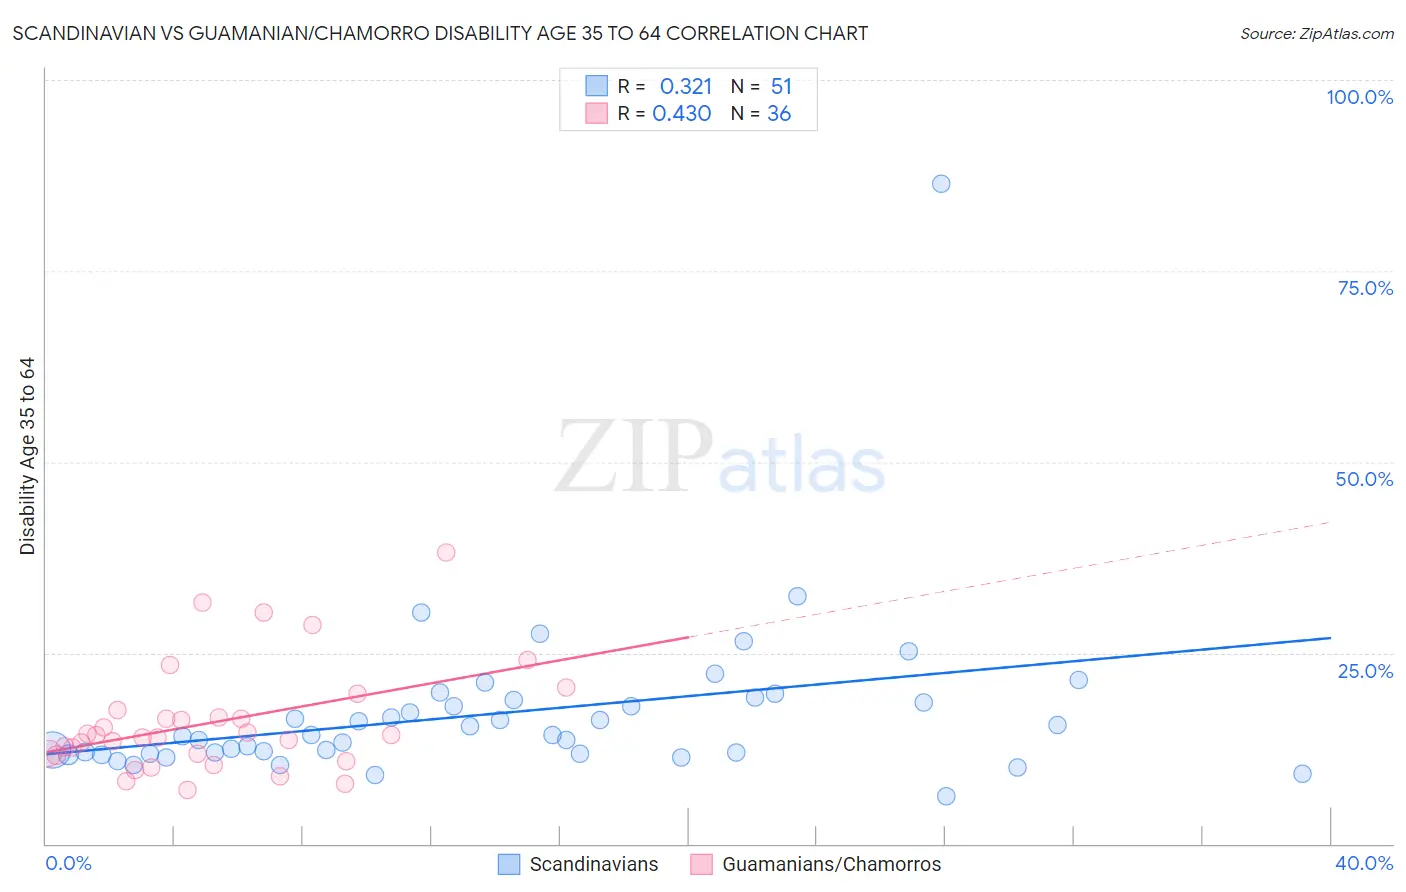
Scandinavian vs Guamanian/Chamorro Disability Age 35 to 64 Correlation Chart
The statistical analysis conducted on geographies consisting of 472,157,412 people shows a mild positive correlation between the proportion of Scandinavians and percentage of population with a disability between the ages 34 and 64 in the United States with a correlation coefficient (R) of 0.321 and weighted average of 11.9%. Similarly, the statistical analysis conducted on geographies consisting of 221,858,951 people shows a moderate positive correlation between the proportion of Guamanians/Chamorros and percentage of population with a disability between the ages 34 and 64 in the United States with a correlation coefficient (R) of 0.430 and weighted average of 12.2%, a difference of 3.0%.
Disability Age 35 to 64 Correlation Summary
| Measurement | Scandinavian | Guamanian/Chamorro |
| Minimum | 6.2% | 7.0% |
| Maximum | 86.4% | 38.2% |
| Range | 80.1% | 31.2% |
| Mean | 17.1% | 15.9% |
| Median | 14.2% | 14.1% |
| Interquartile 25% (IQ1) | 11.8% | 11.7% |
| Interquartile 75% (IQ3) | 18.8% | 17.0% |
| Interquartile Range (IQR) | 6.9% | 5.3% |
| Standard Deviation (Sample) | 11.3% | 7.1% |
| Standard Deviation (Population) | 11.2% | 7.0% |
Demographics Similar to Scandinavians and Guamanians/Chamorros by Disability Age 35 to 64
In terms of disability age 35 to 64, the demographic groups most similar to Scandinavians are Immigrants from Central America (11.9%, a difference of 0.030%), Immigrants from Germany (11.9%, a difference of 0.060%), British West Indian (11.9%, a difference of 0.090%), Panamanian (11.9%, a difference of 0.19%), and Jamaican (11.9%, a difference of 0.22%). Similarly, the demographic groups most similar to Guamanians/Chamorros are Immigrants from Mexico (12.1%, a difference of 0.91%), Finnish (12.1%, a difference of 1.0%), Slovak (12.1%, a difference of 1.3%), Samoan (12.1%, a difference of 1.4%), and Mexican American Indian (12.0%, a difference of 1.6%).
| Demographics | Rating | Rank | Disability Age 35 to 64 |
| Scandinavians | 6.4 /100 | #226 | Tragic 11.9% |
| Immigrants | Central America | 6.3 /100 | #227 | Tragic 11.9% |
| Immigrants | Germany | 6.2 /100 | #228 | Tragic 11.9% |
| British West Indians | 6.1 /100 | #229 | Tragic 11.9% |
| Panamanians | 5.8 /100 | #230 | Tragic 11.9% |
| Jamaicans | 5.7 /100 | #231 | Tragic 11.9% |
| Sudanese | 5.3 /100 | #232 | Tragic 11.9% |
| Bermudans | 5.0 /100 | #233 | Tragic 11.9% |
| Portuguese | 4.9 /100 | #234 | Tragic 11.9% |
| Belizeans | 4.5 /100 | #235 | Tragic 12.0% |
| Immigrants | Middle Africa | 4.5 /100 | #236 | Tragic 12.0% |
| Immigrants | Cambodia | 3.9 /100 | #237 | Tragic 12.0% |
| West Indians | 3.7 /100 | #238 | Tragic 12.0% |
| Immigrants | Western Africa | 3.3 /100 | #239 | Tragic 12.0% |
| Immigrants | Thailand | 3.3 /100 | #240 | Tragic 12.0% |
| Mexican American Indians | 3.2 /100 | #241 | Tragic 12.0% |
| Samoans | 2.8 /100 | #242 | Tragic 12.1% |
| Slovaks | 2.7 /100 | #243 | Tragic 12.1% |
| Finns | 2.3 /100 | #244 | Tragic 12.1% |
| Immigrants | Mexico | 2.2 /100 | #245 | Tragic 12.1% |
| Guamanians/Chamorros | 1.4 /100 | #246 | Tragic 12.2% |