Icelander vs Immigrants from West Indies Male Disability
COMPARE
Icelander
Immigrants from West Indies
Male Disability
Male Disability Comparison
Icelanders
Immigrants from West Indies
11.6%
MALE DISABILITY
10.1/ 100
METRIC RATING
208th/ 347
METRIC RANK
11.1%
MALE DISABILITY
65.7/ 100
METRIC RATING
161st/ 347
METRIC RANK
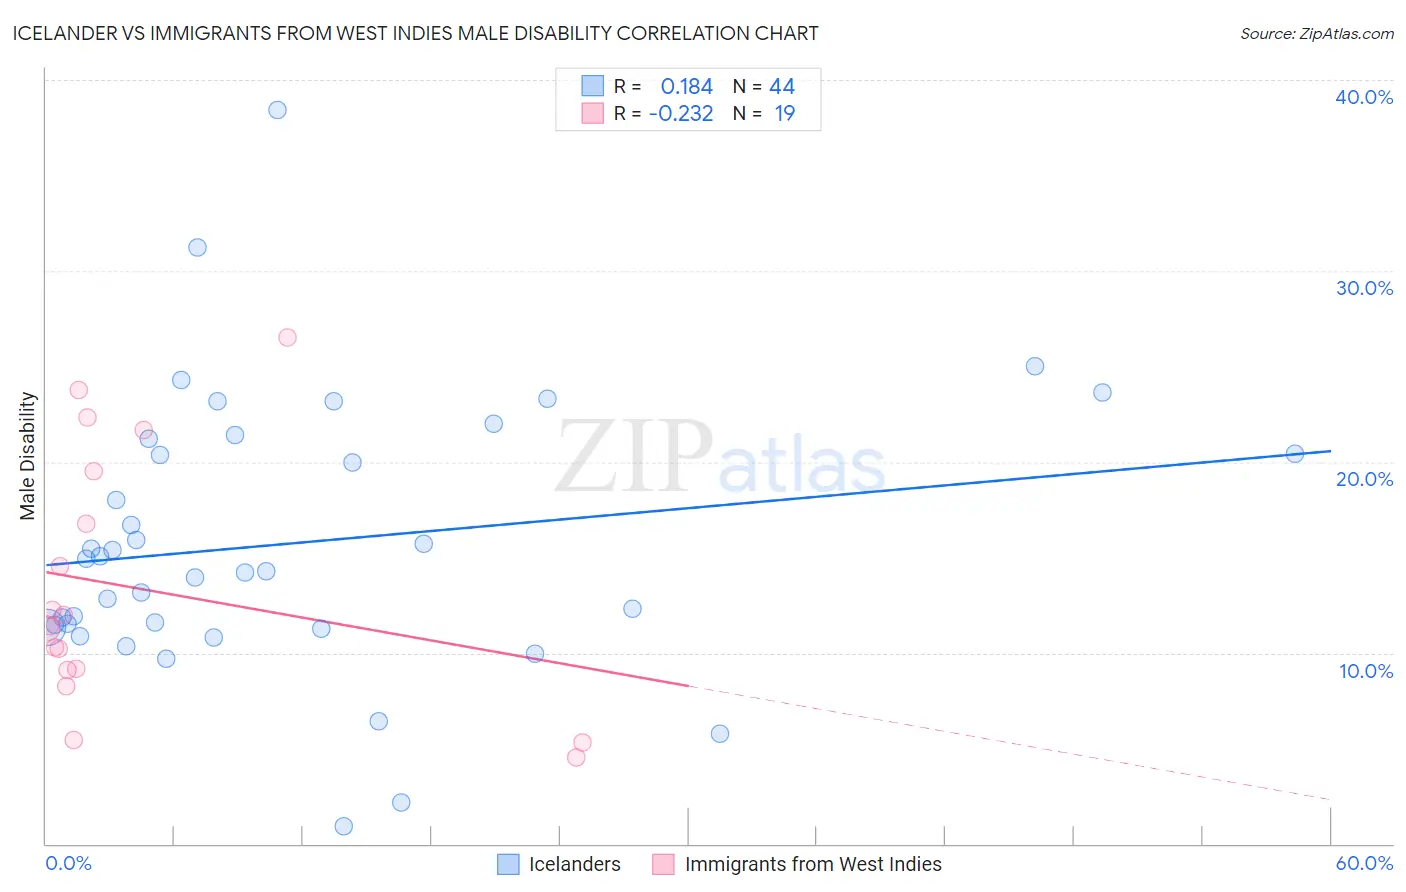
Icelander vs Immigrants from West Indies Male Disability Correlation Chart
The statistical analysis conducted on geographies consisting of 159,644,082 people shows a poor positive correlation between the proportion of Icelanders and percentage of males with a disability in the United States with a correlation coefficient (R) of 0.184 and weighted average of 11.6%. Similarly, the statistical analysis conducted on geographies consisting of 72,456,461 people shows a weak negative correlation between the proportion of Immigrants from West Indies and percentage of males with a disability in the United States with a correlation coefficient (R) of -0.232 and weighted average of 11.1%, a difference of 4.0%.
Male Disability Correlation Summary
| Measurement | Icelander | Immigrants from West Indies |
| Minimum | 0.92% | 4.5% |
| Maximum | 38.5% | 26.5% |
| Range | 37.5% | 22.0% |
| Mean | 15.8% | 13.4% |
| Median | 14.6% | 11.4% |
| Interquartile 25% (IQ1) | 11.4% | 9.1% |
| Interquartile 75% (IQ3) | 20.8% | 19.5% |
| Interquartile Range (IQR) | 9.4% | 10.4% |
| Standard Deviation (Sample) | 7.2% | 6.6% |
| Standard Deviation (Population) | 7.1% | 6.4% |
Similar Demographics by Male Disability
Demographics Similar to Icelanders by Male Disability
In terms of male disability, the demographic groups most similar to Icelanders are Spanish American Indian (11.6%, a difference of 0.010%), Immigrants from Somalia (11.5%, a difference of 0.040%), Ukrainian (11.5%, a difference of 0.070%), Serbian (11.5%, a difference of 0.080%), and Immigrants from Cambodia (11.5%, a difference of 0.090%).
| Demographics | Rating | Rank | Male Disability |
| Immigrants | Panama | 13.0 /100 | #201 | Poor 11.5% |
| Immigrants | Mexico | 12.6 /100 | #202 | Poor 11.5% |
| Jamaicans | 10.9 /100 | #203 | Poor 11.5% |
| Immigrants | Cambodia | 10.8 /100 | #204 | Poor 11.5% |
| Serbians | 10.7 /100 | #205 | Poor 11.5% |
| Ukrainians | 10.6 /100 | #206 | Poor 11.5% |
| Immigrants | Somalia | 10.4 /100 | #207 | Poor 11.5% |
| Icelanders | 10.1 /100 | #208 | Poor 11.6% |
| Spanish American Indians | 10.1 /100 | #209 | Poor 11.6% |
| Ute | 9.4 /100 | #210 | Tragic 11.6% |
| Immigrants | Thailand | 8.4 /100 | #211 | Tragic 11.6% |
| Immigrants | Scotland | 8.2 /100 | #212 | Tragic 11.6% |
| Mexican American Indians | 7.8 /100 | #213 | Tragic 11.6% |
| Lithuanians | 6.6 /100 | #214 | Tragic 11.6% |
| Indonesians | 5.9 /100 | #215 | Tragic 11.6% |
Demographics Similar to Immigrants from West Indies by Male Disability
In terms of male disability, the demographic groups most similar to Immigrants from West Indies are Immigrants from Haiti (11.1%, a difference of 0.020%), Albanian (11.1%, a difference of 0.050%), Guatemalan (11.1%, a difference of 0.090%), Immigrants from Kenya (11.1%, a difference of 0.12%), and Latvian (11.1%, a difference of 0.16%).
| Demographics | Rating | Rank | Male Disability |
| Immigrants | Moldova | 72.8 /100 | #154 | Good 11.1% |
| Immigrants | Middle Africa | 70.9 /100 | #155 | Good 11.1% |
| Russians | 69.8 /100 | #156 | Good 11.1% |
| Immigrants | Western Africa | 69.2 /100 | #157 | Good 11.1% |
| Latvians | 68.1 /100 | #158 | Good 11.1% |
| Guatemalans | 67.2 /100 | #159 | Good 11.1% |
| Albanians | 66.5 /100 | #160 | Good 11.1% |
| Immigrants | West Indies | 65.7 /100 | #161 | Good 11.1% |
| Immigrants | Haiti | 65.3 /100 | #162 | Good 11.1% |
| Immigrants | Kenya | 63.8 /100 | #163 | Good 11.1% |
| British West Indians | 62.8 /100 | #164 | Good 11.1% |
| Luxembourgers | 61.9 /100 | #165 | Good 11.1% |
| Immigrants | Hungary | 61.2 /100 | #166 | Good 11.1% |
| Immigrants | Southern Europe | 54.4 /100 | #167 | Average 11.2% |
| Immigrants | Latin America | 54.0 /100 | #168 | Average 11.2% |