Immigrants from Grenada vs Immigrants from Sudan Ambulatory Disability
COMPARE
Immigrants from Grenada
Immigrants from Sudan
Ambulatory Disability
Ambulatory Disability Comparison
Immigrants from Grenada
Immigrants from Sudan
6.9%
AMBULATORY DISABILITY
0.0/ 100
METRIC RATING
298th/ 347
METRIC RANK
5.8%
AMBULATORY DISABILITY
98.8/ 100
METRIC RATING
91st/ 347
METRIC RANK
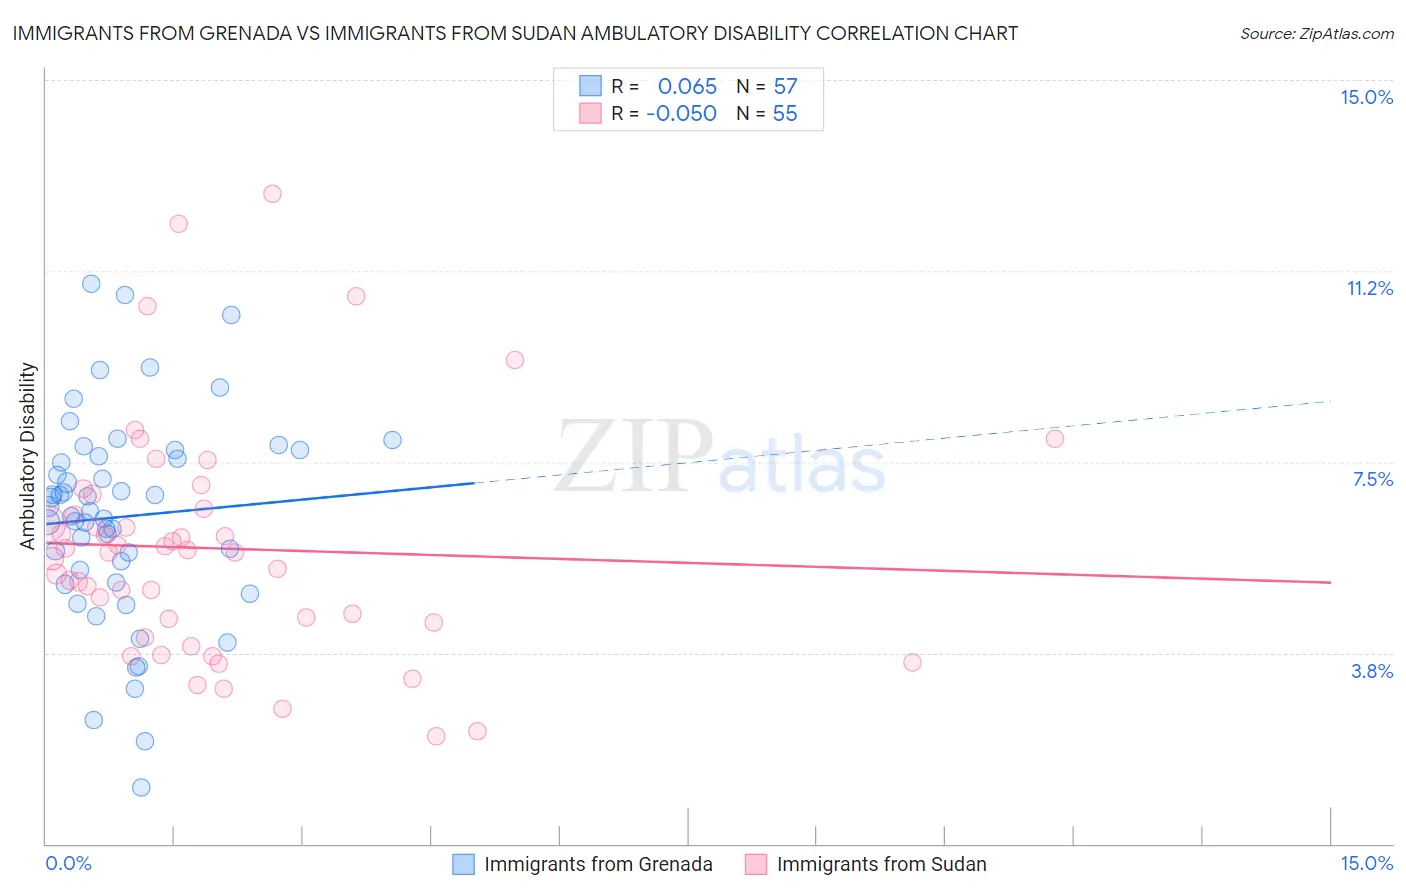
Immigrants from Grenada vs Immigrants from Sudan Ambulatory Disability Correlation Chart
The statistical analysis conducted on geographies consisting of 67,197,356 people shows a slight positive correlation between the proportion of Immigrants from Grenada and percentage of population with ambulatory disability in the United States with a correlation coefficient (R) of 0.065 and weighted average of 6.9%. Similarly, the statistical analysis conducted on geographies consisting of 118,955,409 people shows a slight negative correlation between the proportion of Immigrants from Sudan and percentage of population with ambulatory disability in the United States with a correlation coefficient (R) of -0.050 and weighted average of 5.8%, a difference of 20.4%.
Ambulatory Disability Correlation Summary
| Measurement | Immigrants from Grenada | Immigrants from Sudan |
| Minimum | 1.1% | 2.1% |
| Maximum | 11.0% | 12.8% |
| Range | 9.9% | 10.7% |
| Mean | 6.4% | 5.8% |
| Median | 6.5% | 5.7% |
| Interquartile 25% (IQ1) | 5.2% | 4.3% |
| Interquartile 75% (IQ3) | 7.7% | 6.6% |
| Interquartile Range (IQR) | 2.4% | 2.2% |
| Standard Deviation (Sample) | 2.0% | 2.3% |
| Standard Deviation (Population) | 2.0% | 2.2% |
Similar Demographics by Ambulatory Disability
Demographics Similar to Immigrants from Grenada by Ambulatory Disability
In terms of ambulatory disability, the demographic groups most similar to Immigrants from Grenada are French American Indian (6.9%, a difference of 0.010%), Puget Sound Salish (6.9%, a difference of 0.13%), Marshallese (6.9%, a difference of 0.14%), Alaskan Athabascan (6.9%, a difference of 0.18%), and British West Indian (7.0%, a difference of 0.37%).
| Demographics | Rating | Rank | Ambulatory Disability |
| West Indians | 0.0 /100 | #291 | Tragic 6.9% |
| Cheyenne | 0.0 /100 | #292 | Tragic 6.9% |
| Immigrants | St. Vincent and the Grenadines | 0.0 /100 | #293 | Tragic 6.9% |
| Cape Verdeans | 0.0 /100 | #294 | Tragic 6.9% |
| Crow | 0.0 /100 | #295 | Tragic 6.9% |
| Alaskan Athabascans | 0.0 /100 | #296 | Tragic 6.9% |
| French American Indians | 0.0 /100 | #297 | Tragic 6.9% |
| Immigrants | Grenada | 0.0 /100 | #298 | Tragic 6.9% |
| Puget Sound Salish | 0.0 /100 | #299 | Tragic 6.9% |
| Marshallese | 0.0 /100 | #300 | Tragic 6.9% |
| British West Indians | 0.0 /100 | #301 | Tragic 7.0% |
| Immigrants | Armenia | 0.0 /100 | #302 | Tragic 7.0% |
| Africans | 0.0 /100 | #303 | Tragic 7.0% |
| Immigrants | Cabo Verde | 0.0 /100 | #304 | Tragic 7.0% |
| Immigrants | Micronesia | 0.0 /100 | #305 | Tragic 7.0% |
Demographics Similar to Immigrants from Sudan by Ambulatory Disability
In terms of ambulatory disability, the demographic groups most similar to Immigrants from Sudan are Bhutanese (5.8%, a difference of 0.0%), Australian (5.8%, a difference of 0.0%), Soviet Union (5.8%, a difference of 0.12%), Immigrants from Chile (5.8%, a difference of 0.17%), and Immigrants from Sierra Leone (5.8%, a difference of 0.17%).
| Demographics | Rating | Rank | Ambulatory Disability |
| Ugandans | 99.2 /100 | #84 | Exceptional 5.7% |
| South Americans | 99.0 /100 | #85 | Exceptional 5.7% |
| Latvians | 99.0 /100 | #86 | Exceptional 5.7% |
| Immigrants | Chile | 98.9 /100 | #87 | Exceptional 5.8% |
| Soviet Union | 98.9 /100 | #88 | Exceptional 5.8% |
| Bhutanese | 98.8 /100 | #89 | Exceptional 5.8% |
| Australians | 98.8 /100 | #90 | Exceptional 5.8% |
| Immigrants | Sudan | 98.8 /100 | #91 | Exceptional 5.8% |
| Immigrants | Sierra Leone | 98.6 /100 | #92 | Exceptional 5.8% |
| Immigrants | Denmark | 98.6 /100 | #93 | Exceptional 5.8% |
| Kenyans | 98.4 /100 | #94 | Exceptional 5.8% |
| Immigrants | El Salvador | 98.4 /100 | #95 | Exceptional 5.8% |
| Salvadorans | 98.4 /100 | #96 | Exceptional 5.8% |
| Immigrants | Somalia | 98.3 /100 | #97 | Exceptional 5.8% |
| Immigrants | Lebanon | 98.3 /100 | #98 | Exceptional 5.8% |