Kiowa vs Immigrants from Nicaragua Male Disability
COMPARE
Kiowa
Immigrants from Nicaragua
Male Disability
Male Disability Comparison
Kiowa
Immigrants from Nicaragua
15.4%
MALE DISABILITY
0.0/ 100
METRIC RATING
342nd/ 347
METRIC RANK
10.6%
MALE DISABILITY
97.8/ 100
METRIC RATING
89th/ 347
METRIC RANK
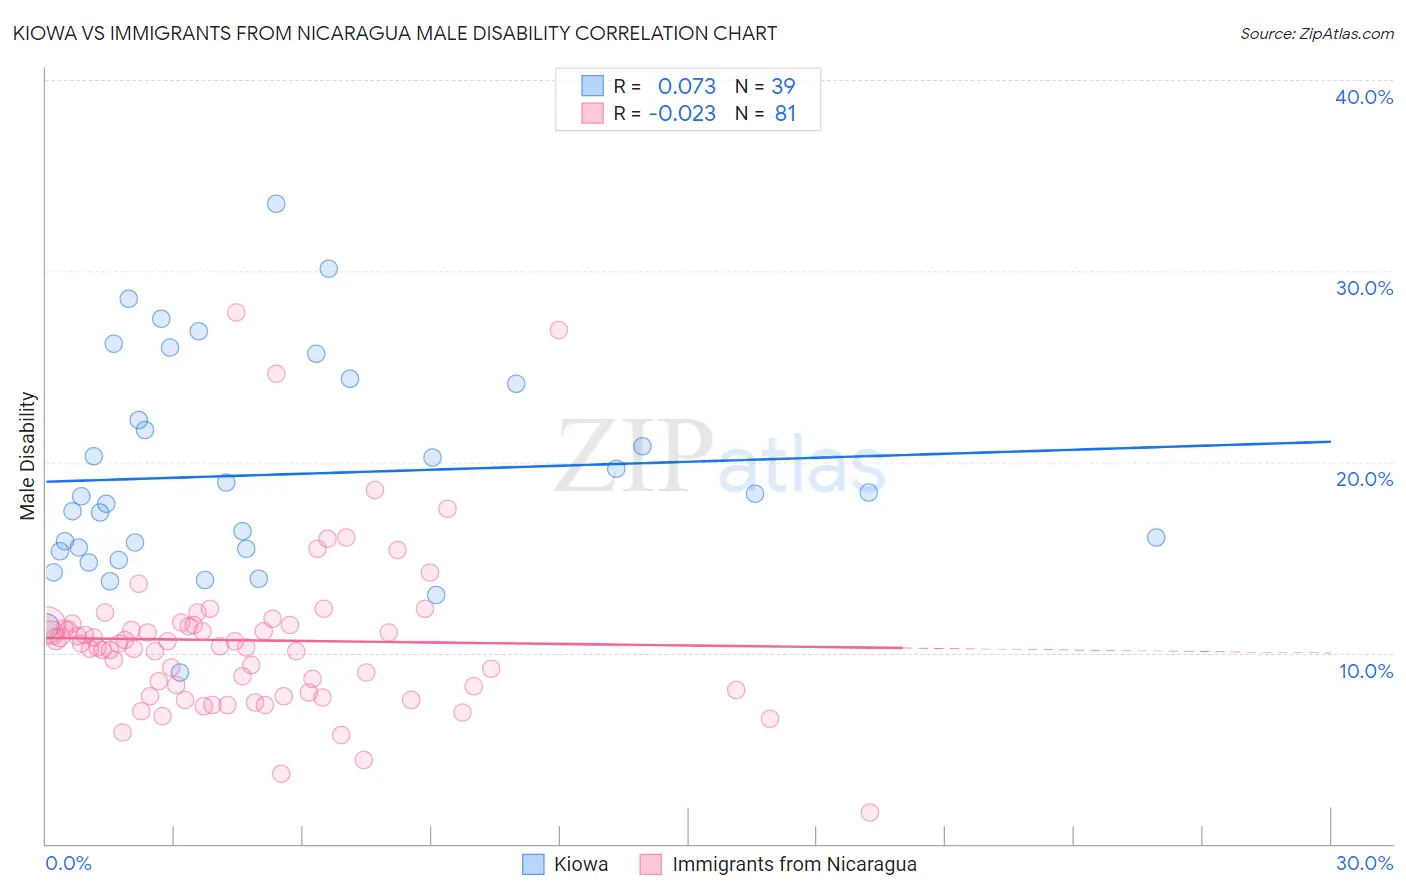
Kiowa vs Immigrants from Nicaragua Male Disability Correlation Chart
The statistical analysis conducted on geographies consisting of 56,098,760 people shows a slight positive correlation between the proportion of Kiowa and percentage of males with a disability in the United States with a correlation coefficient (R) of 0.073 and weighted average of 15.4%. Similarly, the statistical analysis conducted on geographies consisting of 236,327,634 people shows no correlation between the proportion of Immigrants from Nicaragua and percentage of males with a disability in the United States with a correlation coefficient (R) of -0.023 and weighted average of 10.6%, a difference of 45.2%.
Male Disability Correlation Summary
| Measurement | Kiowa | Immigrants from Nicaragua |
| Minimum | 9.0% | 1.6% |
| Maximum | 33.5% | 27.8% |
| Range | 24.5% | 26.2% |
| Mean | 19.3% | 10.7% |
| Median | 18.2% | 10.5% |
| Interquartile 25% (IQ1) | 15.3% | 8.0% |
| Interquartile 75% (IQ3) | 24.1% | 11.4% |
| Interquartile Range (IQR) | 8.8% | 3.5% |
| Standard Deviation (Sample) | 5.6% | 4.2% |
| Standard Deviation (Population) | 5.5% | 4.2% |
Similar Demographics by Male Disability
Demographics Similar to Kiowa by Male Disability
In terms of male disability, the demographic groups most similar to Kiowa are Choctaw (15.4%, a difference of 0.19%), Creek (15.5%, a difference of 0.66%), Puerto Rican (15.6%, a difference of 0.79%), Tsimshian (15.6%, a difference of 1.1%), and Lumbee (15.2%, a difference of 1.3%).
| Demographics | Rating | Rank | Male Disability |
| Yuman | 0.0 /100 | #333 | Tragic 14.7% |
| Cherokee | 0.0 /100 | #334 | Tragic 14.8% |
| Dutch West Indians | 0.0 /100 | #335 | Tragic 14.8% |
| Alaskan Athabascans | 0.0 /100 | #336 | Tragic 14.9% |
| Menominee | 0.0 /100 | #337 | Tragic 15.0% |
| Pueblo | 0.0 /100 | #338 | Tragic 15.0% |
| Chickasaw | 0.0 /100 | #339 | Tragic 15.1% |
| Lumbee | 0.0 /100 | #340 | Tragic 15.2% |
| Choctaw | 0.0 /100 | #341 | Tragic 15.4% |
| Kiowa | 0.0 /100 | #342 | Tragic 15.4% |
| Creek | 0.0 /100 | #343 | Tragic 15.5% |
| Puerto Ricans | 0.0 /100 | #344 | Tragic 15.6% |
| Tsimshian | 0.0 /100 | #345 | Tragic 15.6% |
| Colville | 0.0 /100 | #346 | Tragic 16.5% |
| Houma | 0.0 /100 | #347 | Tragic 17.4% |
Demographics Similar to Immigrants from Nicaragua by Male Disability
In terms of male disability, the demographic groups most similar to Immigrants from Nicaragua are Immigrants from Western Asia (10.6%, a difference of 0.0%), Immigrants from Morocco (10.6%, a difference of 0.050%), Immigrants from Vietnam (10.6%, a difference of 0.070%), Immigrants from Ireland (10.6%, a difference of 0.090%), and Immigrants from France (10.6%, a difference of 0.090%).
| Demographics | Rating | Rank | Male Disability |
| Immigrants | Guyana | 98.2 /100 | #82 | Exceptional 10.6% |
| Immigrants | Poland | 98.1 /100 | #83 | Exceptional 10.6% |
| Bulgarians | 98.1 /100 | #84 | Exceptional 10.6% |
| Sri Lankans | 97.9 /100 | #85 | Exceptional 10.6% |
| Immigrants | Ireland | 97.9 /100 | #86 | Exceptional 10.6% |
| Immigrants | Vietnam | 97.9 /100 | #87 | Exceptional 10.6% |
| Immigrants | Western Asia | 97.8 /100 | #88 | Exceptional 10.6% |
| Immigrants | Nicaragua | 97.8 /100 | #89 | Exceptional 10.6% |
| Immigrants | Morocco | 97.7 /100 | #90 | Exceptional 10.6% |
| Immigrants | France | 97.6 /100 | #91 | Exceptional 10.6% |
| Palestinians | 97.4 /100 | #92 | Exceptional 10.7% |
| Immigrants | St. Vincent and the Grenadines | 97.1 /100 | #93 | Exceptional 10.7% |
| Immigrants | Sweden | 96.9 /100 | #94 | Exceptional 10.7% |
| Chileans | 96.9 /100 | #95 | Exceptional 10.7% |
| Nicaraguans | 96.6 /100 | #96 | Exceptional 10.7% |