Sioux vs Immigrants from Nicaragua 7th Grade
COMPARE
Sioux
Immigrants from Nicaragua
7th Grade
7th Grade Comparison
Sioux
Immigrants from Nicaragua
97.4%
7TH GRADE
100.0/ 100
METRIC RATING
28th/ 347
METRIC RANK
93.0%
7TH GRADE
0.0/ 100
METRIC RATING
328th/ 347
METRIC RANK
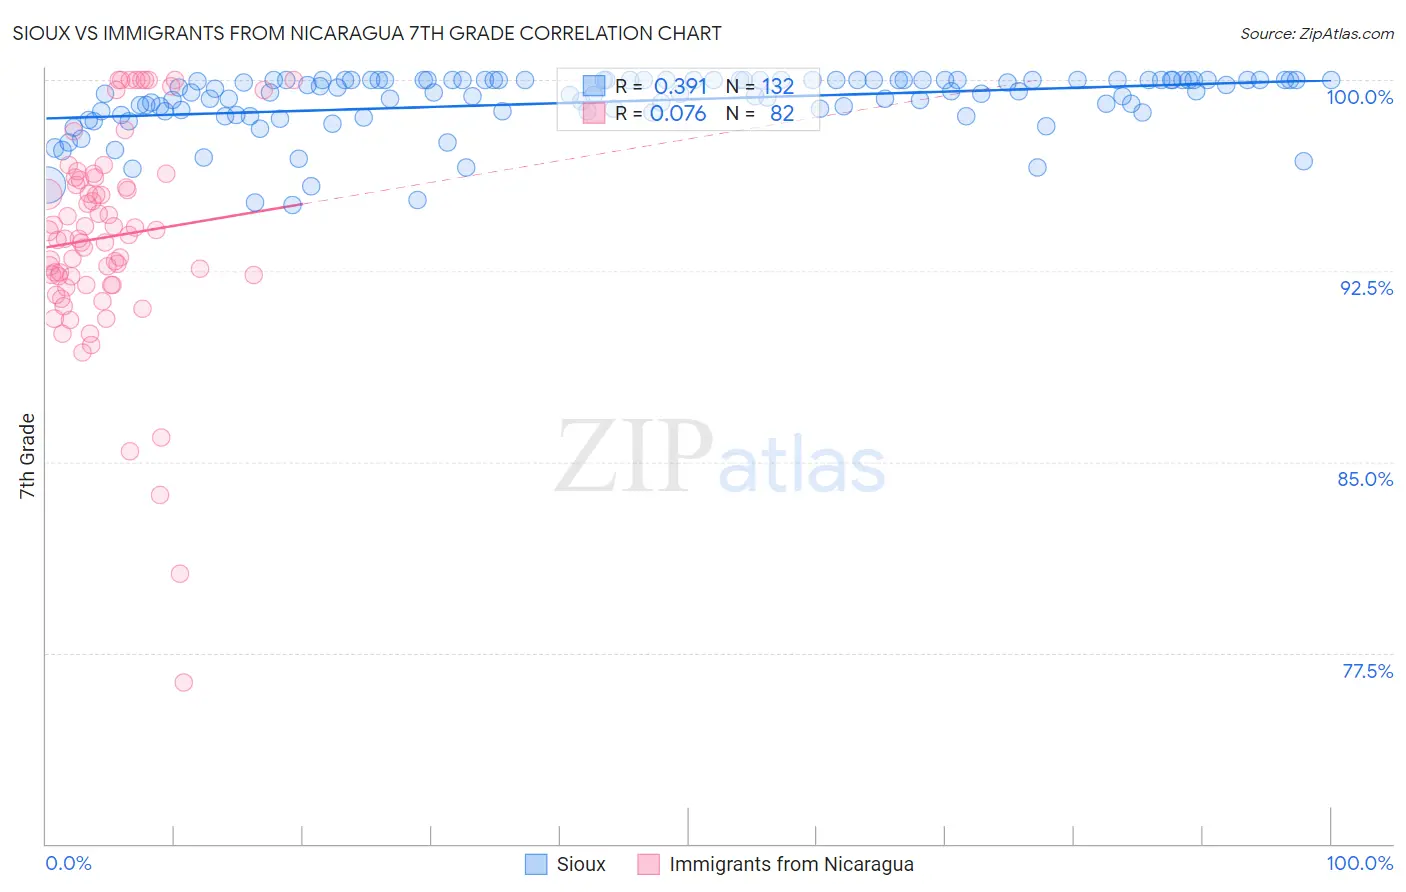
Sioux vs Immigrants from Nicaragua 7th Grade Correlation Chart
The statistical analysis conducted on geographies consisting of 234,197,525 people shows a mild positive correlation between the proportion of Sioux and percentage of population with at least 7th grade education in the United States with a correlation coefficient (R) of 0.391 and weighted average of 97.4%. Similarly, the statistical analysis conducted on geographies consisting of 236,340,506 people shows a slight positive correlation between the proportion of Immigrants from Nicaragua and percentage of population with at least 7th grade education in the United States with a correlation coefficient (R) of 0.076 and weighted average of 93.0%, a difference of 4.7%.
7th Grade Correlation Summary
| Measurement | Sioux | Immigrants from Nicaragua |
| Minimum | 95.1% | 76.3% |
| Maximum | 100.0% | 100.0% |
| Range | 4.9% | 23.7% |
| Mean | 99.1% | 93.8% |
| Median | 99.5% | 93.8% |
| Interquartile 25% (IQ1) | 98.8% | 92.0% |
| Interquartile 75% (IQ3) | 100.0% | 96.2% |
| Interquartile Range (IQR) | 1.2% | 4.2% |
| Standard Deviation (Sample) | 1.2% | 4.2% |
| Standard Deviation (Population) | 1.2% | 4.2% |
Similar Demographics by 7th Grade
Demographics Similar to Sioux by 7th Grade
In terms of 7th grade, the demographic groups most similar to Sioux are Scandinavian (97.4%, a difference of 0.0%), Czech (97.4%, a difference of 0.010%), Scotch-Irish (97.4%, a difference of 0.020%), Danish (97.4%, a difference of 0.020%), and Welsh (97.4%, a difference of 0.030%).
| Demographics | Rating | Rank | 7th Grade |
| Inupiat | 100.0 /100 | #21 | Exceptional 97.4% |
| French Canadians | 100.0 /100 | #22 | Exceptional 97.4% |
| Croatians | 100.0 /100 | #23 | Exceptional 97.4% |
| Welsh | 100.0 /100 | #24 | Exceptional 97.4% |
| French | 100.0 /100 | #25 | Exceptional 97.4% |
| Scotch-Irish | 100.0 /100 | #26 | Exceptional 97.4% |
| Danes | 100.0 /100 | #27 | Exceptional 97.4% |
| Sioux | 100.0 /100 | #28 | Exceptional 97.4% |
| Scandinavians | 100.0 /100 | #29 | Exceptional 97.4% |
| Czechs | 100.0 /100 | #30 | Exceptional 97.4% |
| Europeans | 100.0 /100 | #31 | Exceptional 97.3% |
| Italians | 100.0 /100 | #32 | Exceptional 97.3% |
| Chippewa | 100.0 /100 | #33 | Exceptional 97.3% |
| Alaska Natives | 100.0 /100 | #34 | Exceptional 97.3% |
| Swiss | 100.0 /100 | #35 | Exceptional 97.3% |
Demographics Similar to Immigrants from Nicaragua by 7th Grade
In terms of 7th grade, the demographic groups most similar to Immigrants from Nicaragua are Immigrants from the Azores (93.0%, a difference of 0.040%), Immigrants from Dominican Republic (92.9%, a difference of 0.090%), Immigrants from Cabo Verde (93.1%, a difference of 0.13%), Honduran (92.9%, a difference of 0.13%), and Nepalese (93.2%, a difference of 0.20%).
| Demographics | Rating | Rank | 7th Grade |
| Belizeans | 0.0 /100 | #321 | Tragic 93.5% |
| Nicaraguans | 0.0 /100 | #322 | Tragic 93.5% |
| Immigrants | Belize | 0.0 /100 | #323 | Tragic 93.4% |
| Dominicans | 0.0 /100 | #324 | Tragic 93.3% |
| Central American Indians | 0.0 /100 | #325 | Tragic 93.3% |
| Nepalese | 0.0 /100 | #326 | Tragic 93.2% |
| Immigrants | Cabo Verde | 0.0 /100 | #327 | Tragic 93.1% |
| Immigrants | Nicaragua | 0.0 /100 | #328 | Tragic 93.0% |
| Immigrants | Azores | 0.0 /100 | #329 | Tragic 93.0% |
| Immigrants | Dominican Republic | 0.0 /100 | #330 | Tragic 92.9% |
| Hondurans | 0.0 /100 | #331 | Tragic 92.9% |
| Hispanics or Latinos | 0.0 /100 | #332 | Tragic 92.7% |
| Immigrants | Armenia | 0.0 /100 | #333 | Tragic 92.7% |
| Immigrants | Yemen | 0.0 /100 | #334 | Tragic 92.6% |
| Mexican American Indians | 0.0 /100 | #335 | Tragic 92.6% |