Sioux vs Immigrants from Hong Kong Disability Age 18 to 34
COMPARE
Sioux
Immigrants from Hong Kong
Disability Age 18 to 34
Disability Age 18 to 34 Comparison
Sioux
Immigrants from Hong Kong
8.2%
DISABILITY AGE 18 TO 34
0.0/ 100
METRIC RATING
327th/ 347
METRIC RANK
5.2%
DISABILITY AGE 18 TO 34
100.0/ 100
METRIC RATING
2nd/ 347
METRIC RANK
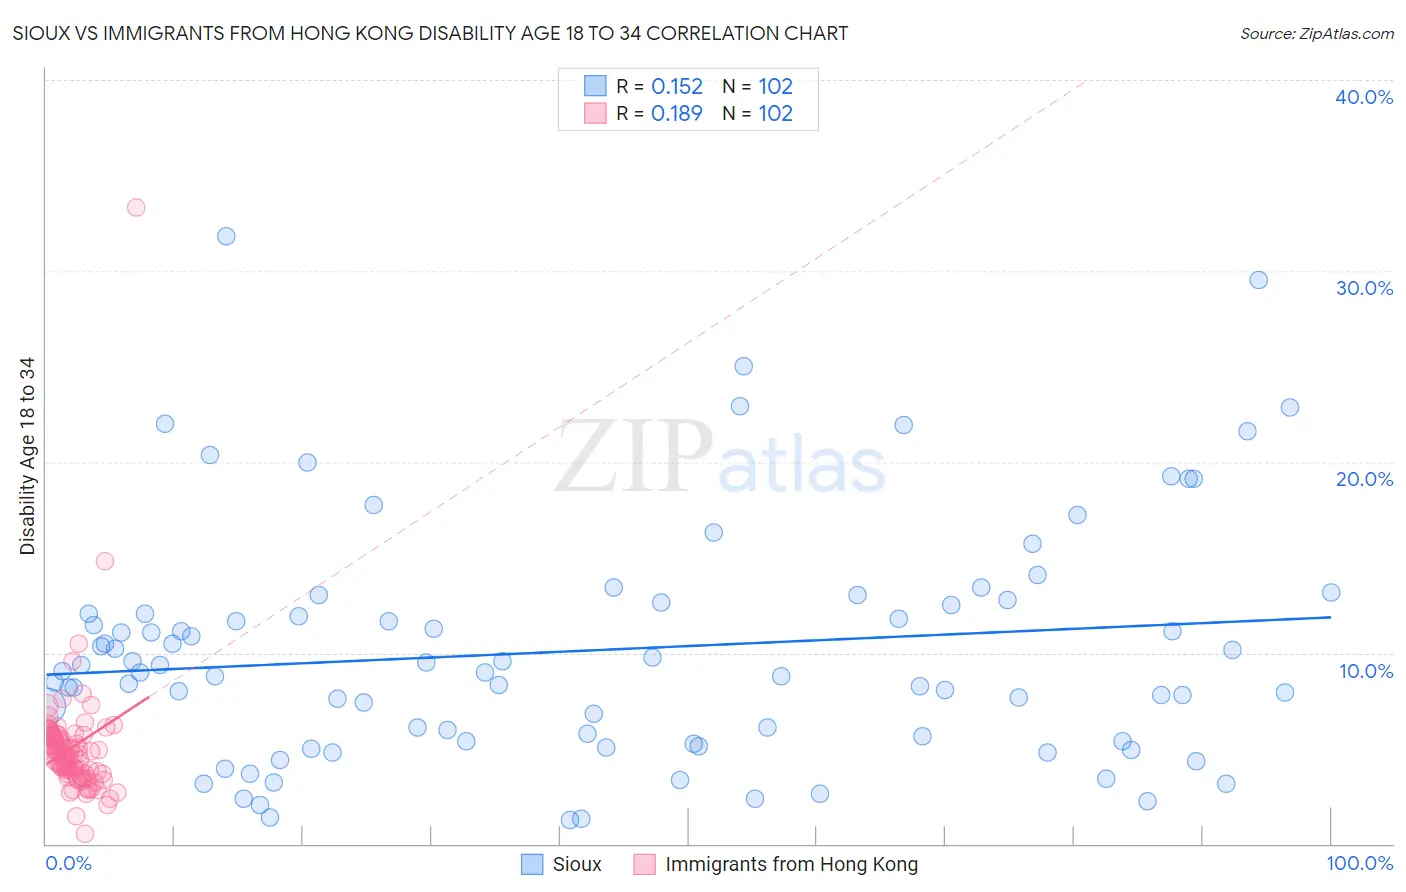
Sioux vs Immigrants from Hong Kong Disability Age 18 to 34 Correlation Chart
The statistical analysis conducted on geographies consisting of 233,703,351 people shows a poor positive correlation between the proportion of Sioux and percentage of population with a disability between the ages 18 and 35 in the United States with a correlation coefficient (R) of 0.152 and weighted average of 8.2%. Similarly, the statistical analysis conducted on geographies consisting of 253,676,267 people shows a poor positive correlation between the proportion of Immigrants from Hong Kong and percentage of population with a disability between the ages 18 and 35 in the United States with a correlation coefficient (R) of 0.189 and weighted average of 5.2%, a difference of 57.8%.
Disability Age 18 to 34 Correlation Summary
| Measurement | Sioux | Immigrants from Hong Kong |
| Minimum | 1.3% | 0.51% |
| Maximum | 31.8% | 33.3% |
| Range | 30.5% | 32.8% |
| Mean | 10.1% | 5.0% |
| Median | 9.0% | 4.7% |
| Interquartile 25% (IQ1) | 5.4% | 3.8% |
| Interquartile 75% (IQ3) | 12.5% | 5.6% |
| Interquartile Range (IQR) | 7.1% | 1.9% |
| Standard Deviation (Sample) | 6.2% | 3.4% |
| Standard Deviation (Population) | 6.2% | 3.3% |
Similar Demographics by Disability Age 18 to 34
Demographics Similar to Sioux by Disability Age 18 to 34
In terms of disability age 18 to 34, the demographic groups most similar to Sioux are Delaware (8.2%, a difference of 0.050%), Potawatomi (8.2%, a difference of 0.13%), Native/Alaskan (8.2%, a difference of 0.14%), Crow (8.3%, a difference of 0.57%), and Cajun (8.2%, a difference of 0.67%).
| Demographics | Rating | Rank | Disability Age 18 to 34 |
| Navajo | 0.0 /100 | #320 | Tragic 8.1% |
| Blackfeet | 0.0 /100 | #321 | Tragic 8.1% |
| Cree | 0.0 /100 | #322 | Tragic 8.1% |
| French American Indians | 0.0 /100 | #323 | Tragic 8.2% |
| Cajuns | 0.0 /100 | #324 | Tragic 8.2% |
| Natives/Alaskans | 0.0 /100 | #325 | Tragic 8.2% |
| Potawatomi | 0.0 /100 | #326 | Tragic 8.2% |
| Sioux | 0.0 /100 | #327 | Tragic 8.2% |
| Delaware | 0.0 /100 | #328 | Tragic 8.2% |
| Crow | 0.0 /100 | #329 | Tragic 8.3% |
| Osage | 0.0 /100 | #330 | Tragic 8.3% |
| Comanche | 0.0 /100 | #331 | Tragic 8.3% |
| Puget Sound Salish | 0.0 /100 | #332 | Tragic 8.3% |
| Apache | 0.0 /100 | #333 | Tragic 8.4% |
| Dutch West Indians | 0.0 /100 | #334 | Tragic 8.4% |
Demographics Similar to Immigrants from Hong Kong by Disability Age 18 to 34
In terms of disability age 18 to 34, the demographic groups most similar to Immigrants from Hong Kong are Immigrants from Grenada (5.3%, a difference of 2.2%), Immigrants from Cuba (5.4%, a difference of 2.8%), Immigrants from Taiwan (5.4%, a difference of 3.1%), Immigrants from Armenia (5.0%, a difference of 4.3%), and Filipino (5.4%, a difference of 4.4%).
| Demographics | Rating | Rank | Disability Age 18 to 34 |
| Immigrants | Armenia | 100.0 /100 | #1 | Exceptional 5.0% |
| Immigrants | Hong Kong | 100.0 /100 | #2 | Exceptional 5.2% |
| Immigrants | Grenada | 100.0 /100 | #3 | Exceptional 5.3% |
| Immigrants | Cuba | 100.0 /100 | #4 | Exceptional 5.4% |
| Immigrants | Taiwan | 100.0 /100 | #5 | Exceptional 5.4% |
| Filipinos | 100.0 /100 | #6 | Exceptional 5.4% |
| Immigrants | China | 100.0 /100 | #7 | Exceptional 5.4% |
| Immigrants | Guyana | 100.0 /100 | #8 | Exceptional 5.5% |
| Guyanese | 100.0 /100 | #9 | Exceptional 5.5% |
| Immigrants | Uzbekistan | 100.0 /100 | #10 | Exceptional 5.5% |
| Vietnamese | 100.0 /100 | #11 | Exceptional 5.5% |
| Immigrants | St. Vincent and the Grenadines | 100.0 /100 | #12 | Exceptional 5.5% |
| Immigrants | Iran | 100.0 /100 | #13 | Exceptional 5.5% |
| Indians (Asian) | 100.0 /100 | #14 | Exceptional 5.5% |
| Immigrants | India | 100.0 /100 | #15 | Exceptional 5.6% |