Shoshone vs Panamanian Vision Disability
COMPARE
Shoshone
Panamanian
Vision Disability
Vision Disability Comparison
Shoshone
Panamanians
2.7%
VISION DISABILITY
0.0/ 100
METRIC RATING
316th/ 347
METRIC RANK
2.3%
VISION DISABILITY
0.9/ 100
METRIC RATING
240th/ 347
METRIC RANK
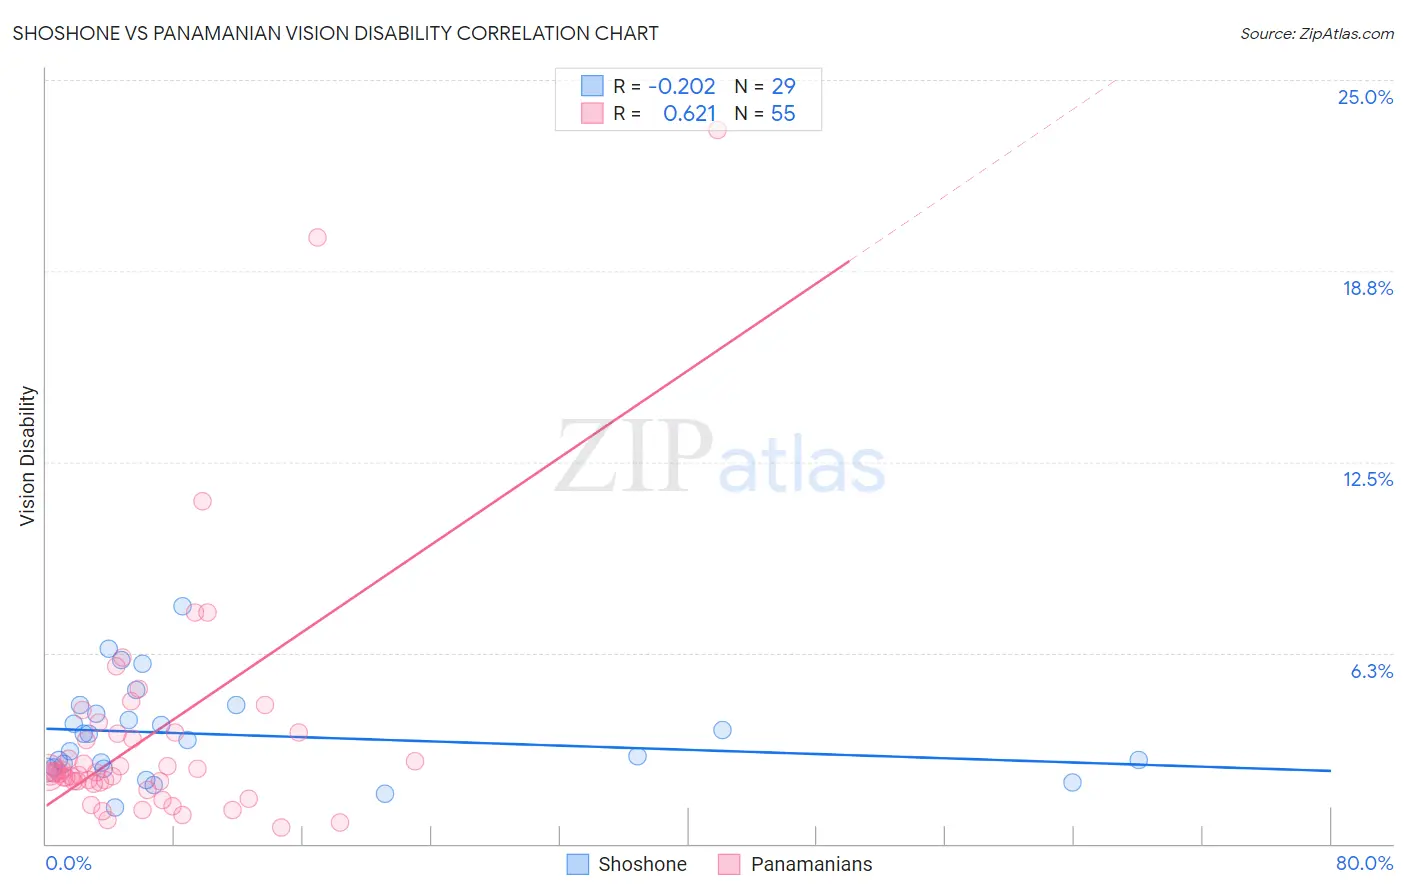
Shoshone vs Panamanian Vision Disability Correlation Chart
The statistical analysis conducted on geographies consisting of 66,614,475 people shows a weak negative correlation between the proportion of Shoshone and percentage of population with vision disability in the United States with a correlation coefficient (R) of -0.202 and weighted average of 2.7%. Similarly, the statistical analysis conducted on geographies consisting of 281,084,996 people shows a significant positive correlation between the proportion of Panamanians and percentage of population with vision disability in the United States with a correlation coefficient (R) of 0.621 and weighted average of 2.3%, a difference of 15.9%.
Vision Disability Correlation Summary
| Measurement | Shoshone | Panamanian |
| Minimum | 1.2% | 0.54% |
| Maximum | 7.8% | 23.4% |
| Range | 6.6% | 22.8% |
| Mean | 3.6% | 3.5% |
| Median | 3.4% | 2.3% |
| Interquartile 25% (IQ1) | 2.5% | 2.0% |
| Interquartile 75% (IQ3) | 4.4% | 3.6% |
| Interquartile Range (IQR) | 1.9% | 1.6% |
| Standard Deviation (Sample) | 1.5% | 4.0% |
| Standard Deviation (Population) | 1.5% | 4.0% |
Similar Demographics by Vision Disability
Demographics Similar to Shoshone by Vision Disability
In terms of vision disability, the demographic groups most similar to Shoshone are Yup'ik (2.7%, a difference of 0.20%), Osage (2.7%, a difference of 0.43%), Alaska Native (2.7%, a difference of 1.3%), Inupiat (2.7%, a difference of 1.6%), and Potawatomi (2.6%, a difference of 1.7%).
| Demographics | Rating | Rank | Vision Disability |
| Immigrants | Yemen | 0.0 /100 | #309 | Tragic 2.6% |
| Blackfeet | 0.0 /100 | #310 | Tragic 2.6% |
| Dominicans | 0.0 /100 | #311 | Tragic 2.6% |
| Americans | 0.0 /100 | #312 | Tragic 2.6% |
| Potawatomi | 0.0 /100 | #313 | Tragic 2.6% |
| Inupiat | 0.0 /100 | #314 | Tragic 2.7% |
| Osage | 0.0 /100 | #315 | Tragic 2.7% |
| Shoshone | 0.0 /100 | #316 | Tragic 2.7% |
| Yup'ik | 0.0 /100 | #317 | Tragic 2.7% |
| Alaska Natives | 0.0 /100 | #318 | Tragic 2.7% |
| Tohono O'odham | 0.0 /100 | #319 | Tragic 2.8% |
| Blacks/African Americans | 0.0 /100 | #320 | Tragic 2.8% |
| Comanche | 0.0 /100 | #321 | Tragic 2.8% |
| Paiute | 0.0 /100 | #322 | Tragic 2.9% |
| Tlingit-Haida | 0.0 /100 | #323 | Tragic 2.9% |
Demographics Similar to Panamanians by Vision Disability
In terms of vision disability, the demographic groups most similar to Panamanians are Malaysian (2.3%, a difference of 0.030%), Immigrants from Panama (2.3%, a difference of 0.18%), English (2.3%, a difference of 0.25%), Immigrants from Cambodia (2.3%, a difference of 0.27%), and Immigrants from Portugal (2.3%, a difference of 0.54%).
| Demographics | Rating | Rank | Vision Disability |
| Central Americans | 1.8 /100 | #233 | Tragic 2.3% |
| Scottish | 1.6 /100 | #234 | Tragic 2.3% |
| Marshallese | 1.5 /100 | #235 | Tragic 2.3% |
| Immigrants | Congo | 1.4 /100 | #236 | Tragic 2.3% |
| Immigrants | Portugal | 1.4 /100 | #237 | Tragic 2.3% |
| Immigrants | Cambodia | 1.1 /100 | #238 | Tragic 2.3% |
| English | 1.1 /100 | #239 | Tragic 2.3% |
| Panamanians | 0.9 /100 | #240 | Tragic 2.3% |
| Malaysians | 0.9 /100 | #241 | Tragic 2.3% |
| Immigrants | Panama | 0.8 /100 | #242 | Tragic 2.3% |
| Immigrants | Nicaragua | 0.6 /100 | #243 | Tragic 2.3% |
| Immigrants | West Indies | 0.6 /100 | #244 | Tragic 2.3% |
| Alsatians | 0.6 /100 | #245 | Tragic 2.3% |
| French | 0.5 /100 | #246 | Tragic 2.3% |
| Guatemalans | 0.5 /100 | #247 | Tragic 2.3% |