Serbian vs Scotch-Irish Ambulatory Disability
COMPARE
Serbian
Scotch-Irish
Ambulatory Disability
Ambulatory Disability Comparison
Serbians
Scotch-Irish
6.1%
AMBULATORY DISABILITY
42.8/ 100
METRIC RATING
182nd/ 347
METRIC RANK
6.9%
AMBULATORY DISABILITY
0.0/ 100
METRIC RATING
290th/ 347
METRIC RANK
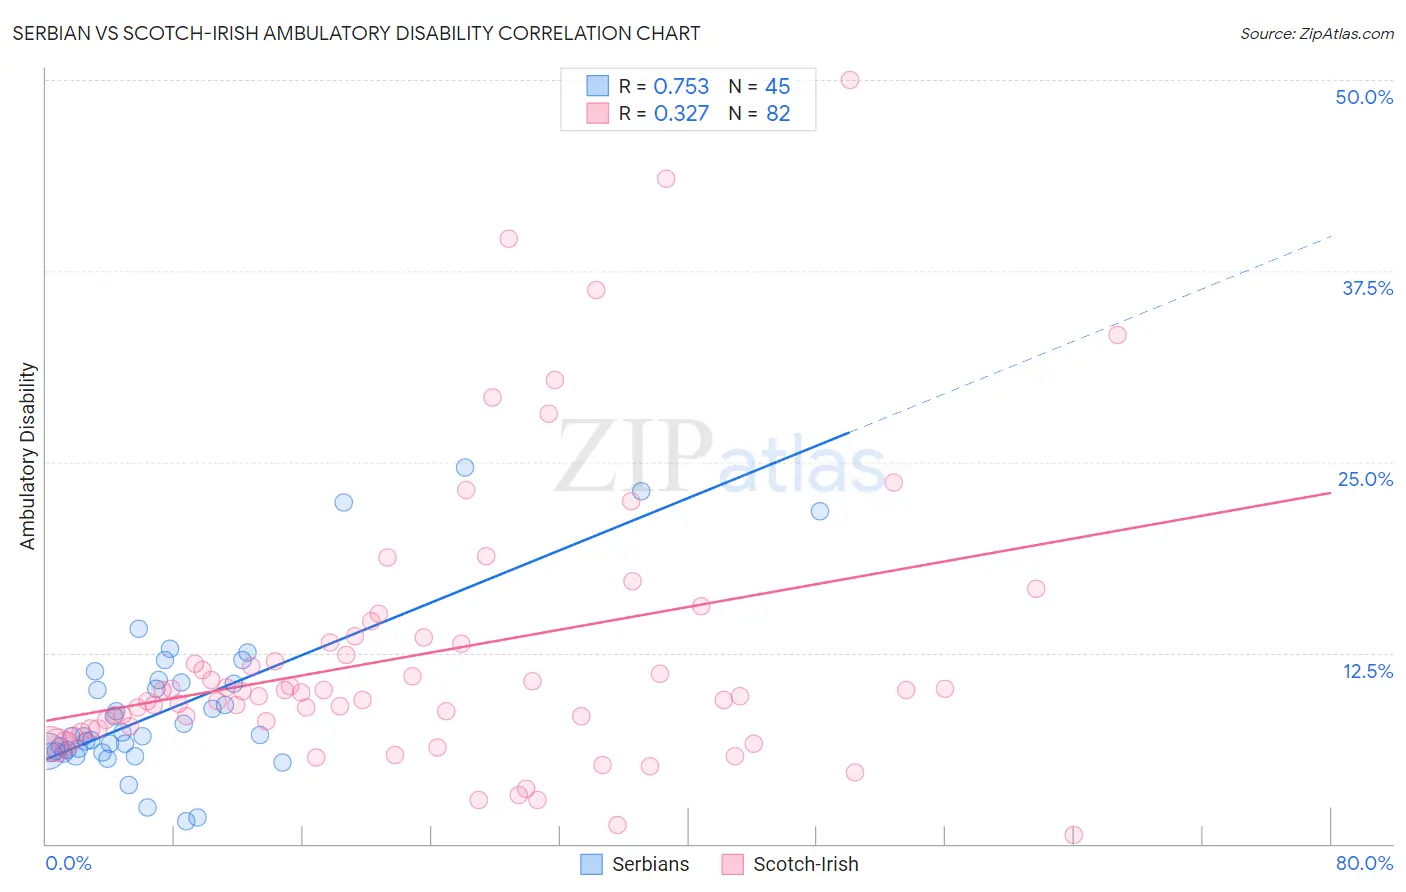
Serbian vs Scotch-Irish Ambulatory Disability Correlation Chart
The statistical analysis conducted on geographies consisting of 267,596,356 people shows a strong positive correlation between the proportion of Serbians and percentage of population with ambulatory disability in the United States with a correlation coefficient (R) of 0.753 and weighted average of 6.1%. Similarly, the statistical analysis conducted on geographies consisting of 548,439,452 people shows a mild positive correlation between the proportion of Scotch-Irish and percentage of population with ambulatory disability in the United States with a correlation coefficient (R) of 0.327 and weighted average of 6.9%, a difference of 11.8%.
Ambulatory Disability Correlation Summary
| Measurement | Serbian | Scotch-Irish |
| Minimum | 1.5% | 0.57% |
| Maximum | 24.6% | 50.0% |
| Range | 23.2% | 49.4% |
| Mean | 9.0% | 12.4% |
| Median | 7.1% | 9.8% |
| Interquartile 25% (IQ1) | 6.0% | 7.5% |
| Interquartile 75% (IQ3) | 10.6% | 13.2% |
| Interquartile Range (IQR) | 4.6% | 5.6% |
| Standard Deviation (Sample) | 5.2% | 9.3% |
| Standard Deviation (Population) | 5.2% | 9.2% |
Similar Demographics by Ambulatory Disability
Demographics Similar to Serbians by Ambulatory Disability
In terms of ambulatory disability, the demographic groups most similar to Serbians are Swiss (6.1%, a difference of 0.010%), Immigrants from Thailand (6.1%, a difference of 0.030%), Immigrants from Nicaragua (6.1%, a difference of 0.060%), Austrian (6.1%, a difference of 0.070%), and Scandinavian (6.1%, a difference of 0.090%).
| Demographics | Rating | Rank | Ambulatory Disability |
| Vietnamese | 47.2 /100 | #175 | Average 6.1% |
| Immigrants | North America | 45.6 /100 | #176 | Average 6.1% |
| Immigrants | England | 45.4 /100 | #177 | Average 6.1% |
| Scandinavians | 44.5 /100 | #178 | Average 6.1% |
| Austrians | 44.1 /100 | #179 | Average 6.1% |
| Immigrants | Nicaragua | 43.9 /100 | #180 | Average 6.1% |
| Swiss | 43.1 /100 | #181 | Average 6.1% |
| Serbians | 42.8 /100 | #182 | Average 6.1% |
| Immigrants | Thailand | 42.2 /100 | #183 | Average 6.1% |
| Immigrants | Ghana | 41.2 /100 | #184 | Average 6.1% |
| Immigrants | Bosnia and Herzegovina | 37.2 /100 | #185 | Fair 6.2% |
| Europeans | 36.2 /100 | #186 | Fair 6.2% |
| Carpatho Rusyns | 35.3 /100 | #187 | Fair 6.2% |
| British | 34.3 /100 | #188 | Fair 6.2% |
| Ukrainians | 34.0 /100 | #189 | Fair 6.2% |
Demographics Similar to Scotch-Irish by Ambulatory Disability
In terms of ambulatory disability, the demographic groups most similar to Scotch-Irish are Immigrants from Dominica (6.9%, a difference of 0.030%), West Indian (6.9%, a difference of 0.10%), Cheyenne (6.9%, a difference of 0.16%), Nonimmigrants (6.9%, a difference of 0.17%), and Immigrants from St. Vincent and the Grenadines (6.9%, a difference of 0.40%).
| Demographics | Rating | Rank | Ambulatory Disability |
| Immigrants | Barbados | 0.0 /100 | #283 | Tragic 6.8% |
| Immigrants | Jamaica | 0.0 /100 | #284 | Tragic 6.8% |
| Fijians | 0.0 /100 | #285 | Tragic 6.8% |
| Yakama | 0.0 /100 | #286 | Tragic 6.8% |
| U.S. Virgin Islanders | 0.0 /100 | #287 | Tragic 6.8% |
| Immigrants | Nonimmigrants | 0.0 /100 | #288 | Tragic 6.9% |
| Immigrants | Dominica | 0.0 /100 | #289 | Tragic 6.9% |
| Scotch-Irish | 0.0 /100 | #290 | Tragic 6.9% |
| West Indians | 0.0 /100 | #291 | Tragic 6.9% |
| Cheyenne | 0.0 /100 | #292 | Tragic 6.9% |
| Immigrants | St. Vincent and the Grenadines | 0.0 /100 | #293 | Tragic 6.9% |
| Cape Verdeans | 0.0 /100 | #294 | Tragic 6.9% |
| Crow | 0.0 /100 | #295 | Tragic 6.9% |
| Alaskan Athabascans | 0.0 /100 | #296 | Tragic 6.9% |
| French American Indians | 0.0 /100 | #297 | Tragic 6.9% |