Serbian vs Immigrants from Norway Disability Age 35 to 64
COMPARE
Serbian
Immigrants from Norway
Disability Age 35 to 64
Disability Age 35 to 64 Comparison
Serbians
Immigrants from Norway
11.0%
DISABILITY AGE 35 TO 64
73.6/ 100
METRIC RATING
159th/ 347
METRIC RANK
10.6%
DISABILITY AGE 35 TO 64
95.0/ 100
METRIC RATING
122nd/ 347
METRIC RANK
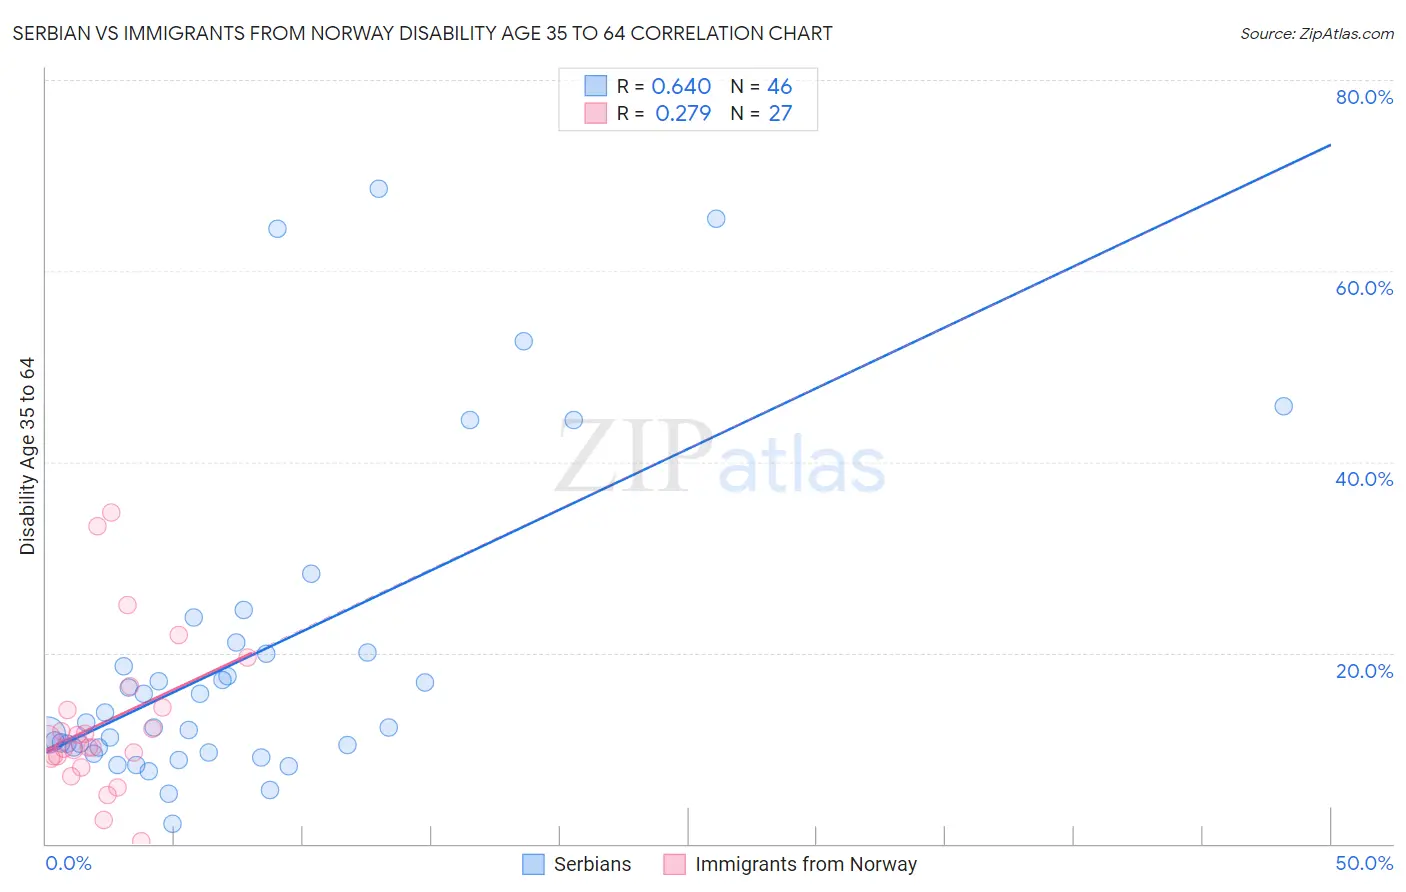
Serbian vs Immigrants from Norway Disability Age 35 to 64 Correlation Chart
The statistical analysis conducted on geographies consisting of 267,515,714 people shows a significant positive correlation between the proportion of Serbians and percentage of population with a disability between the ages 34 and 64 in the United States with a correlation coefficient (R) of 0.640 and weighted average of 11.0%. Similarly, the statistical analysis conducted on geographies consisting of 116,678,139 people shows a weak positive correlation between the proportion of Immigrants from Norway and percentage of population with a disability between the ages 34 and 64 in the United States with a correlation coefficient (R) of 0.279 and weighted average of 10.6%, a difference of 4.1%.
Disability Age 35 to 64 Correlation Summary
| Measurement | Serbian | Immigrants from Norway |
| Minimum | 2.0% | 0.20% |
| Maximum | 68.6% | 34.7% |
| Range | 66.5% | 34.5% |
| Mean | 19.5% | 12.7% |
| Median | 12.4% | 10.0% |
| Interquartile 25% (IQ1) | 10.1% | 9.0% |
| Interquartile 75% (IQ3) | 20.0% | 14.3% |
| Interquartile Range (IQR) | 9.9% | 5.3% |
| Standard Deviation (Sample) | 16.6% | 8.1% |
| Standard Deviation (Population) | 16.4% | 8.0% |
Similar Demographics by Disability Age 35 to 64
Demographics Similar to Serbians by Disability Age 35 to 64
In terms of disability age 35 to 64, the demographic groups most similar to Serbians are Croatian (11.0%, a difference of 0.050%), Immigrants from North America (11.0%, a difference of 0.14%), Guyanese (11.0%, a difference of 0.16%), Immigrants from Sierra Leone (11.0%, a difference of 0.29%), and Moroccan (11.0%, a difference of 0.31%).
| Demographics | Rating | Rank | Disability Age 35 to 64 |
| Ukrainians | 78.0 /100 | #152 | Good 11.0% |
| Immigrants | England | 77.4 /100 | #153 | Good 11.0% |
| Immigrants | Canada | 76.7 /100 | #154 | Good 11.0% |
| Moroccans | 76.4 /100 | #155 | Good 11.0% |
| Immigrants | Sierra Leone | 76.2 /100 | #156 | Good 11.0% |
| Guyanese | 75.1 /100 | #157 | Good 11.0% |
| Immigrants | North America | 74.9 /100 | #158 | Good 11.0% |
| Serbians | 73.6 /100 | #159 | Good 11.0% |
| Croatians | 73.1 /100 | #160 | Good 11.0% |
| Immigrants | Guyana | 70.1 /100 | #161 | Good 11.1% |
| Immigrants | Grenada | 68.4 /100 | #162 | Good 11.1% |
| Immigrants | St. Vincent and the Grenadines | 66.6 /100 | #163 | Good 11.1% |
| Pakistanis | 65.8 /100 | #164 | Good 11.1% |
| Immigrants | Western Europe | 65.2 /100 | #165 | Good 11.1% |
| Immigrants | Haiti | 63.8 /100 | #166 | Good 11.1% |
Demographics Similar to Immigrants from Norway by Disability Age 35 to 64
In terms of disability age 35 to 64, the demographic groups most similar to Immigrants from Norway are Romanian (10.6%, a difference of 0.030%), Maltese (10.6%, a difference of 0.090%), Vietnamese (10.6%, a difference of 0.20%), Estonian (10.6%, a difference of 0.21%), and Luxembourger (10.6%, a difference of 0.22%).
| Demographics | Rating | Rank | Disability Age 35 to 64 |
| Immigrants | Netherlands | 96.3 /100 | #115 | Exceptional 10.5% |
| Immigrants | Nepal | 95.9 /100 | #116 | Exceptional 10.6% |
| Immigrants | South Eastern Asia | 95.7 /100 | #117 | Exceptional 10.6% |
| Immigrants | Moldova | 95.5 /100 | #118 | Exceptional 10.6% |
| Luxembourgers | 95.5 /100 | #119 | Exceptional 10.6% |
| Vietnamese | 95.4 /100 | #120 | Exceptional 10.6% |
| Romanians | 95.0 /100 | #121 | Exceptional 10.6% |
| Immigrants | Norway | 95.0 /100 | #122 | Exceptional 10.6% |
| Maltese | 94.8 /100 | #123 | Exceptional 10.6% |
| Estonians | 94.5 /100 | #124 | Exceptional 10.6% |
| Albanians | 94.2 /100 | #125 | Exceptional 10.6% |
| Immigrants | Afghanistan | 94.1 /100 | #126 | Exceptional 10.6% |
| Immigrants | Zimbabwe | 94.0 /100 | #127 | Exceptional 10.6% |
| South Africans | 93.3 /100 | #128 | Exceptional 10.7% |
| Ecuadorians | 93.1 /100 | #129 | Exceptional 10.7% |