Immigrants from Nepal vs Ugandan Female Disability
COMPARE
Immigrants from Nepal
Ugandan
Female Disability
Female Disability Comparison
Immigrants from Nepal
Ugandans
11.3%
FEMALE DISABILITY
100.0/ 100
METRIC RATING
46th/ 347
METRIC RANK
11.9%
FEMALE DISABILITY
94.0/ 100
METRIC RATING
136th/ 347
METRIC RANK
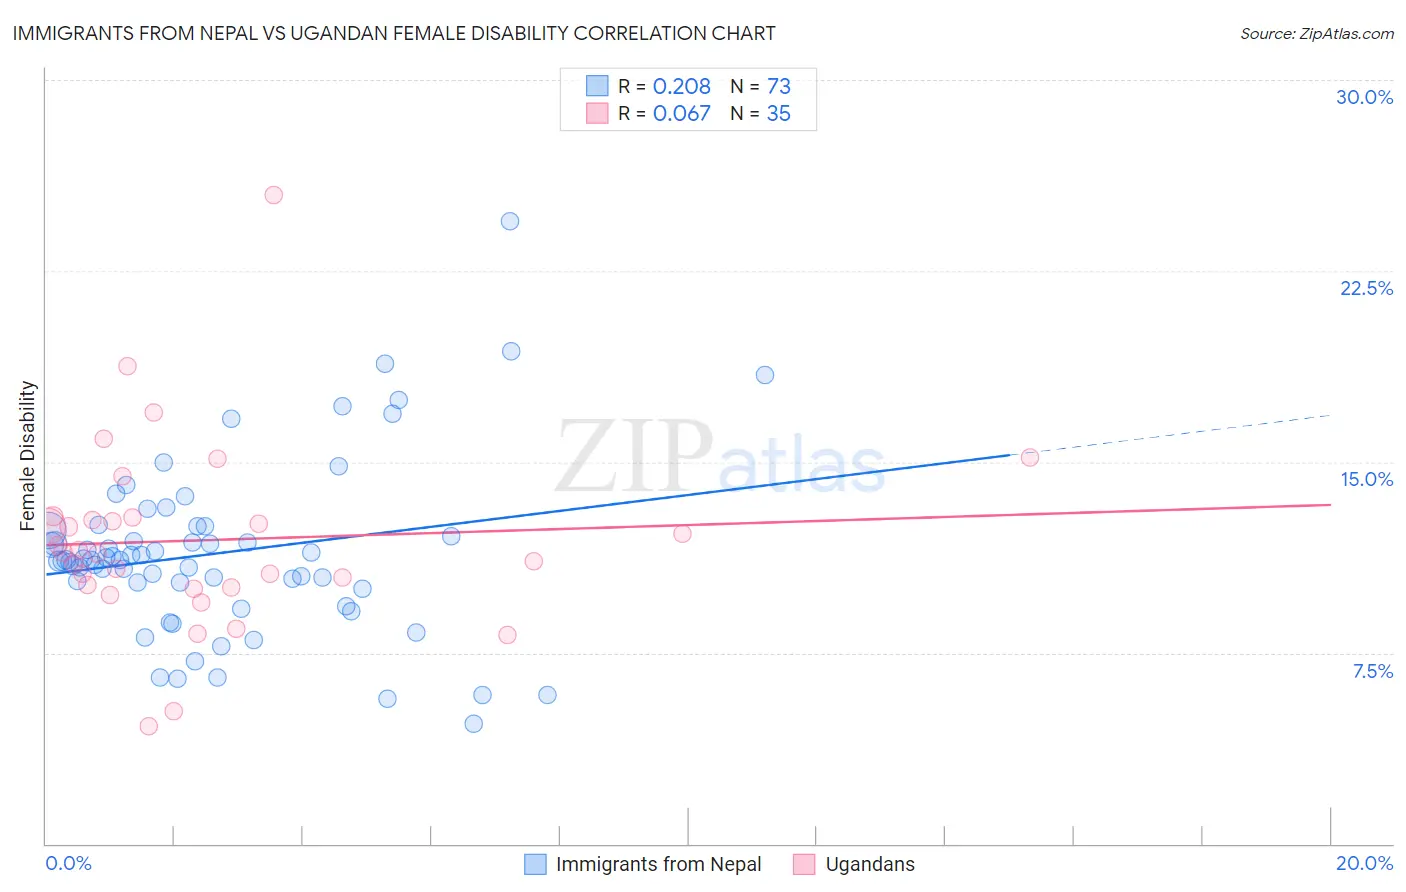
Immigrants from Nepal vs Ugandan Female Disability Correlation Chart
The statistical analysis conducted on geographies consisting of 186,780,675 people shows a weak positive correlation between the proportion of Immigrants from Nepal and percentage of females with a disability in the United States with a correlation coefficient (R) of 0.208 and weighted average of 11.3%. Similarly, the statistical analysis conducted on geographies consisting of 94,017,186 people shows a slight positive correlation between the proportion of Ugandans and percentage of females with a disability in the United States with a correlation coefficient (R) of 0.067 and weighted average of 11.9%, a difference of 5.4%.
Female Disability Correlation Summary
| Measurement | Immigrants from Nepal | Ugandan |
| Minimum | 4.7% | 4.6% |
| Maximum | 24.4% | 25.5% |
| Range | 19.7% | 20.8% |
| Mean | 11.4% | 11.9% |
| Median | 11.1% | 11.5% |
| Interquartile 25% (IQ1) | 10.1% | 10.1% |
| Interquartile 75% (IQ3) | 12.4% | 12.8% |
| Interquartile Range (IQR) | 2.2% | 2.8% |
| Standard Deviation (Sample) | 3.4% | 3.7% |
| Standard Deviation (Population) | 3.4% | 3.7% |
Similar Demographics by Female Disability
Demographics Similar to Immigrants from Nepal by Female Disability
In terms of female disability, the demographic groups most similar to Immigrants from Nepal are Jordanian (11.3%, a difference of 0.020%), Zimbabwean (11.3%, a difference of 0.020%), Tongan (11.3%, a difference of 0.030%), Immigrants from Sweden (11.3%, a difference of 0.050%), and Cambodian (11.3%, a difference of 0.080%).
| Demographics | Rating | Rank | Female Disability |
| Immigrants | Lithuania | 100.0 /100 | #39 | Exceptional 11.2% |
| Mongolians | 100.0 /100 | #40 | Exceptional 11.2% |
| Paraguayans | 100.0 /100 | #41 | Exceptional 11.2% |
| Israelis | 100.0 /100 | #42 | Exceptional 11.2% |
| Afghans | 100.0 /100 | #43 | Exceptional 11.2% |
| Cambodians | 100.0 /100 | #44 | Exceptional 11.3% |
| Immigrants | Sweden | 100.0 /100 | #45 | Exceptional 11.3% |
| Immigrants | Nepal | 100.0 /100 | #46 | Exceptional 11.3% |
| Jordanians | 100.0 /100 | #47 | Exceptional 11.3% |
| Zimbabweans | 100.0 /100 | #48 | Exceptional 11.3% |
| Tongans | 100.0 /100 | #49 | Exceptional 11.3% |
| Inupiat | 100.0 /100 | #50 | Exceptional 11.3% |
| Immigrants | Belgium | 100.0 /100 | #51 | Exceptional 11.3% |
| Immigrants | Peru | 99.9 /100 | #52 | Exceptional 11.3% |
| Immigrants | Saudi Arabia | 99.9 /100 | #53 | Exceptional 11.3% |
Demographics Similar to Ugandans by Female Disability
In terms of female disability, the demographic groups most similar to Ugandans are Central American (11.9%, a difference of 0.030%), Immigrants from Norway (11.9%, a difference of 0.040%), Kenyan (11.9%, a difference of 0.090%), Immigrants from Nicaragua (11.9%, a difference of 0.090%), and Immigrants from Syria (11.9%, a difference of 0.10%).
| Demographics | Rating | Rank | Female Disability |
| Macedonians | 95.5 /100 | #129 | Exceptional 11.8% |
| Nicaraguans | 95.2 /100 | #130 | Exceptional 11.9% |
| Arabs | 95.1 /100 | #131 | Exceptional 11.9% |
| Immigrants | Syria | 94.6 /100 | #132 | Exceptional 11.9% |
| Kenyans | 94.5 /100 | #133 | Exceptional 11.9% |
| Immigrants | Nicaragua | 94.5 /100 | #134 | Exceptional 11.9% |
| Central Americans | 94.2 /100 | #135 | Exceptional 11.9% |
| Ugandans | 94.0 /100 | #136 | Exceptional 11.9% |
| Immigrants | Norway | 93.8 /100 | #137 | Exceptional 11.9% |
| Ecuadorians | 93.4 /100 | #138 | Exceptional 11.9% |
| Immigrants | Hungary | 92.8 /100 | #139 | Exceptional 11.9% |
| Romanians | 91.6 /100 | #140 | Exceptional 11.9% |
| Immigrants | Ecuador | 91.5 /100 | #141 | Exceptional 11.9% |
| Immigrants | Africa | 90.0 /100 | #142 | Excellent 11.9% |
| Immigrants | Sudan | 89.6 /100 | #143 | Excellent 11.9% |