Immigrants from Poland vs Ugandan Female Disability
COMPARE
Immigrants from Poland
Ugandan
Female Disability
Female Disability Comparison
Immigrants from Poland
Ugandans
11.6%
FEMALE DISABILITY
99.6/ 100
METRIC RATING
84th/ 347
METRIC RANK
11.9%
FEMALE DISABILITY
94.0/ 100
METRIC RATING
136th/ 347
METRIC RANK
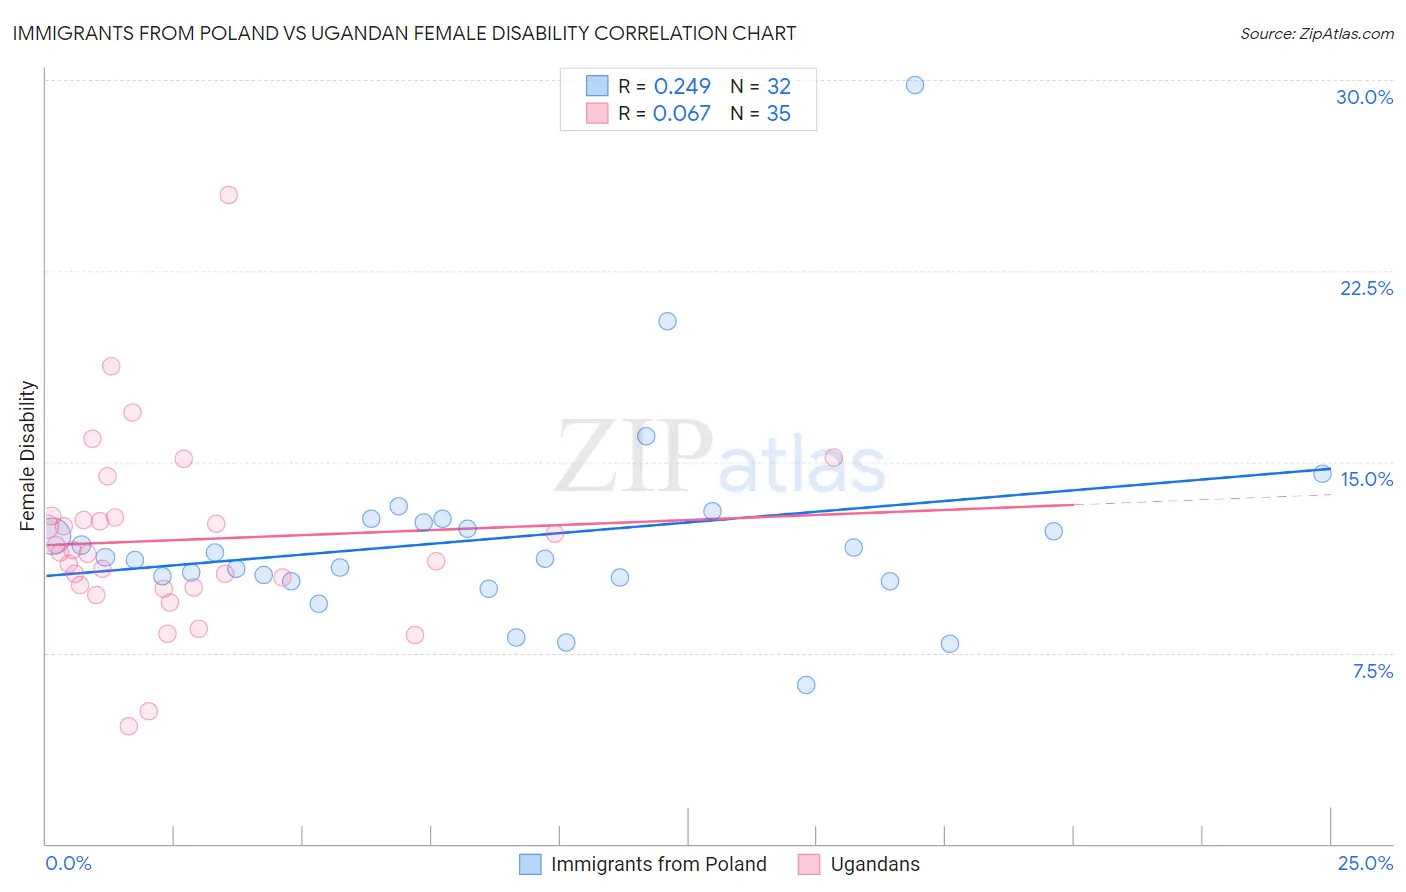
Immigrants from Poland vs Ugandan Female Disability Correlation Chart
The statistical analysis conducted on geographies consisting of 304,835,870 people shows a weak positive correlation between the proportion of Immigrants from Poland and percentage of females with a disability in the United States with a correlation coefficient (R) of 0.249 and weighted average of 11.6%. Similarly, the statistical analysis conducted on geographies consisting of 94,017,186 people shows a slight positive correlation between the proportion of Ugandans and percentage of females with a disability in the United States with a correlation coefficient (R) of 0.067 and weighted average of 11.9%, a difference of 2.7%.
Female Disability Correlation Summary
| Measurement | Immigrants from Poland | Ugandan |
| Minimum | 6.2% | 4.6% |
| Maximum | 29.8% | 25.5% |
| Range | 23.6% | 20.8% |
| Mean | 12.0% | 11.9% |
| Median | 11.2% | 11.5% |
| Interquartile 25% (IQ1) | 10.4% | 10.1% |
| Interquartile 75% (IQ3) | 12.7% | 12.8% |
| Interquartile Range (IQR) | 2.3% | 2.8% |
| Standard Deviation (Sample) | 4.1% | 3.7% |
| Standard Deviation (Population) | 4.1% | 3.7% |
Similar Demographics by Female Disability
Demographics Similar to Immigrants from Poland by Female Disability
In terms of female disability, the demographic groups most similar to Immigrants from Poland are Immigrants from Serbia (11.6%, a difference of 0.030%), Palestinian (11.6%, a difference of 0.030%), Immigrants from Cameroon (11.6%, a difference of 0.040%), Luxembourger (11.6%, a difference of 0.050%), and Immigrants from Denmark (11.6%, a difference of 0.10%).
| Demographics | Rating | Rank | Female Disability |
| Immigrants | Afghanistan | 99.7 /100 | #77 | Exceptional 11.5% |
| Immigrants | South Africa | 99.7 /100 | #78 | Exceptional 11.5% |
| Sierra Leoneans | 99.7 /100 | #79 | Exceptional 11.5% |
| Immigrants | Jordan | 99.7 /100 | #80 | Exceptional 11.5% |
| Eastern Europeans | 99.7 /100 | #81 | Exceptional 11.5% |
| Luxembourgers | 99.6 /100 | #82 | Exceptional 11.6% |
| Immigrants | Serbia | 99.6 /100 | #83 | Exceptional 11.6% |
| Immigrants | Poland | 99.6 /100 | #84 | Exceptional 11.6% |
| Palestinians | 99.6 /100 | #85 | Exceptional 11.6% |
| Immigrants | Cameroon | 99.6 /100 | #86 | Exceptional 11.6% |
| Immigrants | Denmark | 99.5 /100 | #87 | Exceptional 11.6% |
| Yup'ik | 99.5 /100 | #88 | Exceptional 11.6% |
| Vietnamese | 99.5 /100 | #89 | Exceptional 11.6% |
| Immigrants | Romania | 99.5 /100 | #90 | Exceptional 11.6% |
| Immigrants | Zimbabwe | 99.5 /100 | #91 | Exceptional 11.6% |
Demographics Similar to Ugandans by Female Disability
In terms of female disability, the demographic groups most similar to Ugandans are Central American (11.9%, a difference of 0.030%), Immigrants from Norway (11.9%, a difference of 0.040%), Kenyan (11.9%, a difference of 0.090%), Immigrants from Nicaragua (11.9%, a difference of 0.090%), and Immigrants from Syria (11.9%, a difference of 0.10%).
| Demographics | Rating | Rank | Female Disability |
| Macedonians | 95.5 /100 | #129 | Exceptional 11.8% |
| Nicaraguans | 95.2 /100 | #130 | Exceptional 11.9% |
| Arabs | 95.1 /100 | #131 | Exceptional 11.9% |
| Immigrants | Syria | 94.6 /100 | #132 | Exceptional 11.9% |
| Kenyans | 94.5 /100 | #133 | Exceptional 11.9% |
| Immigrants | Nicaragua | 94.5 /100 | #134 | Exceptional 11.9% |
| Central Americans | 94.2 /100 | #135 | Exceptional 11.9% |
| Ugandans | 94.0 /100 | #136 | Exceptional 11.9% |
| Immigrants | Norway | 93.8 /100 | #137 | Exceptional 11.9% |
| Ecuadorians | 93.4 /100 | #138 | Exceptional 11.9% |
| Immigrants | Hungary | 92.8 /100 | #139 | Exceptional 11.9% |
| Romanians | 91.6 /100 | #140 | Exceptional 11.9% |
| Immigrants | Ecuador | 91.5 /100 | #141 | Exceptional 11.9% |
| Immigrants | Africa | 90.0 /100 | #142 | Excellent 11.9% |
| Immigrants | Sudan | 89.6 /100 | #143 | Excellent 11.9% |