Senegalese vs Immigrants from Venezuela 1 or more Vehicles in Household
COMPARE
Senegalese
Immigrants from Venezuela
1 or more Vehicles in Household
1 or more Vehicles in Household Comparison
Senegalese
Immigrants from Venezuela
80.4%
1 OR MORE VEHICLES IN HOUSEHOLD
0.0/ 100
METRIC RATING
325th/ 347
METRIC RANK
92.0%
1 OR MORE VEHICLES IN HOUSEHOLD
99.9/ 100
METRIC RATING
56th/ 347
METRIC RANK
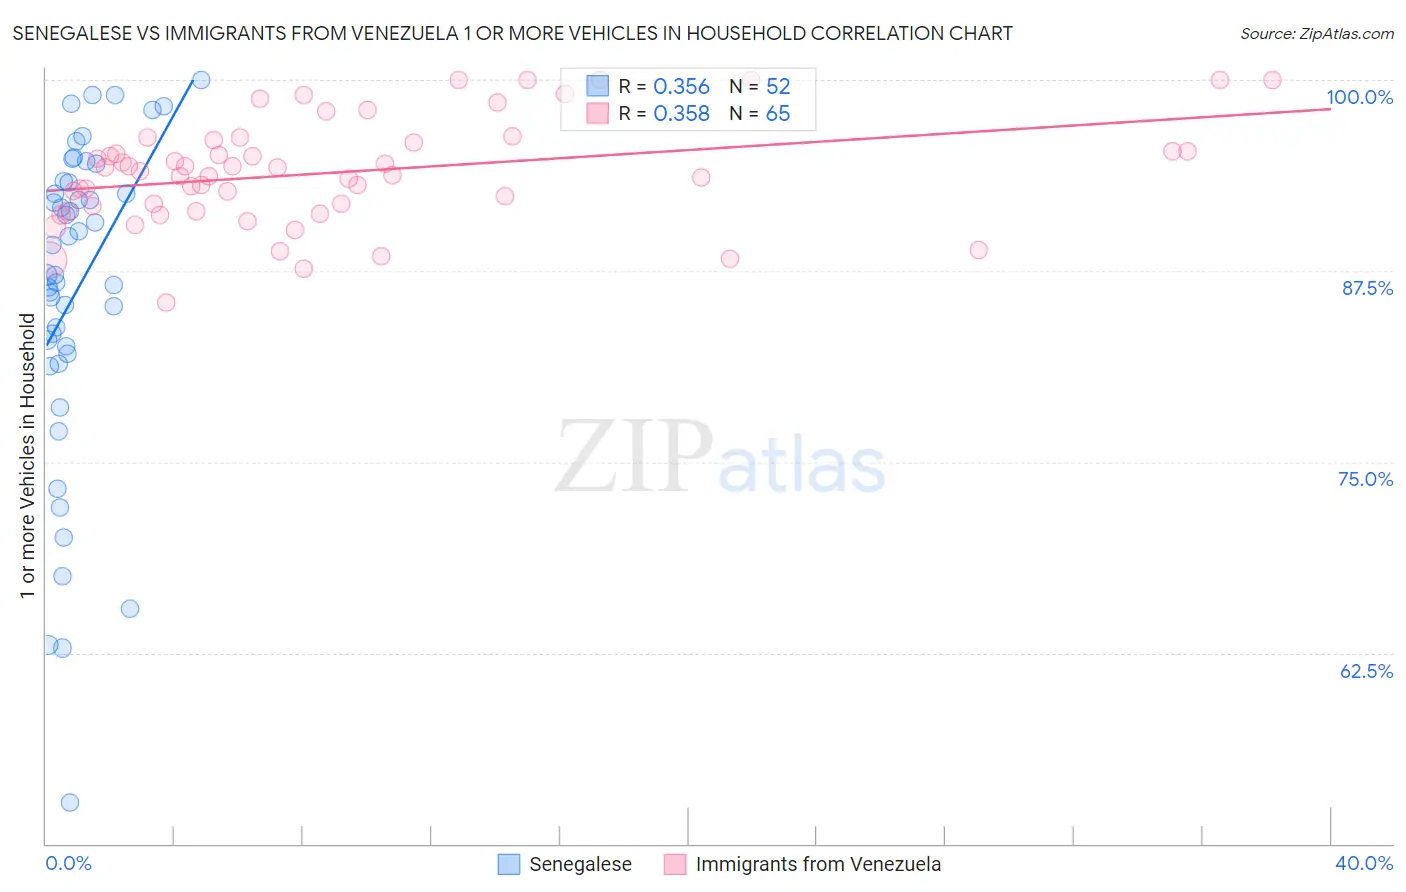
Senegalese vs Immigrants from Venezuela 1 or more Vehicles in Household Correlation Chart
The statistical analysis conducted on geographies consisting of 78,083,411 people shows a mild positive correlation between the proportion of Senegalese and percentage of households with 1 or more vehicles available in the United States with a correlation coefficient (R) of 0.356 and weighted average of 80.4%. Similarly, the statistical analysis conducted on geographies consisting of 287,799,516 people shows a mild positive correlation between the proportion of Immigrants from Venezuela and percentage of households with 1 or more vehicles available in the United States with a correlation coefficient (R) of 0.358 and weighted average of 92.0%, a difference of 14.5%.
1 or more Vehicles in Household Correlation Summary
| Measurement | Senegalese | Immigrants from Venezuela |
| Minimum | 52.7% | 85.4% |
| Maximum | 100.0% | 100.0% |
| Range | 47.3% | 14.6% |
| Mean | 86.2% | 94.0% |
| Median | 88.2% | 94.0% |
| Interquartile 25% (IQ1) | 82.3% | 91.6% |
| Interquartile 75% (IQ3) | 93.3% | 96.0% |
| Interquartile Range (IQR) | 11.0% | 4.4% |
| Standard Deviation (Sample) | 10.6% | 3.4% |
| Standard Deviation (Population) | 10.5% | 3.4% |
Similar Demographics by 1 or more Vehicles in Household
Demographics Similar to Senegalese by 1 or more Vehicles in Household
In terms of 1 or more vehicles in household, the demographic groups most similar to Senegalese are Immigrants from Caribbean (80.4%, a difference of 0.10%), Immigrants from Yemen (80.5%, a difference of 0.22%), Immigrants from West Indies (79.5%, a difference of 1.1%), Immigrants from Cabo Verde (81.6%, a difference of 1.5%), and Immigrants from Senegal (79.0%, a difference of 1.7%).
| Demographics | Rating | Rank | 1 or more Vehicles in Household |
| Immigrants | Ghana | 0.0 /100 | #318 | Tragic 83.4% |
| Immigrants | Belarus | 0.0 /100 | #319 | Tragic 83.3% |
| Soviet Union | 0.0 /100 | #320 | Tragic 82.7% |
| Jamaicans | 0.0 /100 | #321 | Tragic 82.1% |
| Immigrants | Cabo Verde | 0.0 /100 | #322 | Tragic 81.6% |
| Immigrants | Yemen | 0.0 /100 | #323 | Tragic 80.5% |
| Immigrants | Caribbean | 0.0 /100 | #324 | Tragic 80.4% |
| Senegalese | 0.0 /100 | #325 | Tragic 80.4% |
| Immigrants | West Indies | 0.0 /100 | #326 | Tragic 79.5% |
| Immigrants | Senegal | 0.0 /100 | #327 | Tragic 79.0% |
| Ecuadorians | 0.0 /100 | #328 | Tragic 77.9% |
| Immigrants | Dominica | 0.0 /100 | #329 | Tragic 77.8% |
| Immigrants | Trinidad and Tobago | 0.0 /100 | #330 | Tragic 76.8% |
| West Indians | 0.0 /100 | #331 | Tragic 76.4% |
| Trinidadians and Tobagonians | 0.0 /100 | #332 | Tragic 76.3% |
Demographics Similar to Immigrants from Venezuela by 1 or more Vehicles in Household
In terms of 1 or more vehicles in household, the demographic groups most similar to Immigrants from Venezuela are Immigrants from Afghanistan (92.0%, a difference of 0.0%), Iraqi (91.9%, a difference of 0.040%), Slovene (92.0%, a difference of 0.060%), Immigrants from Mexico (91.9%, a difference of 0.060%), and Hawaiian (92.0%, a difference of 0.070%).
| Demographics | Rating | Rank | 1 or more Vehicles in Household |
| Afghans | 99.9 /100 | #49 | Exceptional 92.1% |
| Guamanians/Chamorros | 99.9 /100 | #50 | Exceptional 92.1% |
| Celtics | 99.9 /100 | #51 | Exceptional 92.1% |
| Koreans | 99.9 /100 | #52 | Exceptional 92.1% |
| Hawaiians | 99.9 /100 | #53 | Exceptional 92.0% |
| Slovenes | 99.9 /100 | #54 | Exceptional 92.0% |
| Immigrants | Afghanistan | 99.9 /100 | #55 | Exceptional 92.0% |
| Immigrants | Venezuela | 99.9 /100 | #56 | Exceptional 92.0% |
| Iraqis | 99.8 /100 | #57 | Exceptional 91.9% |
| Immigrants | Mexico | 99.8 /100 | #58 | Exceptional 91.9% |
| Venezuelans | 99.8 /100 | #59 | Exceptional 91.9% |
| Slovaks | 99.8 /100 | #60 | Exceptional 91.9% |
| Immigrants | India | 99.8 /100 | #61 | Exceptional 91.9% |
| Thais | 99.8 /100 | #62 | Exceptional 91.9% |
| Chinese | 99.8 /100 | #63 | Exceptional 91.9% |