Senegalese vs Immigrants from Germany Vision Disability
COMPARE
Senegalese
Immigrants from Germany
Vision Disability
Vision Disability Comparison
Senegalese
Immigrants from Germany
2.4%
VISION DISABILITY
0.1/ 100
METRIC RATING
268th/ 347
METRIC RANK
2.3%
VISION DISABILITY
3.0/ 100
METRIC RATING
226th/ 347
METRIC RANK
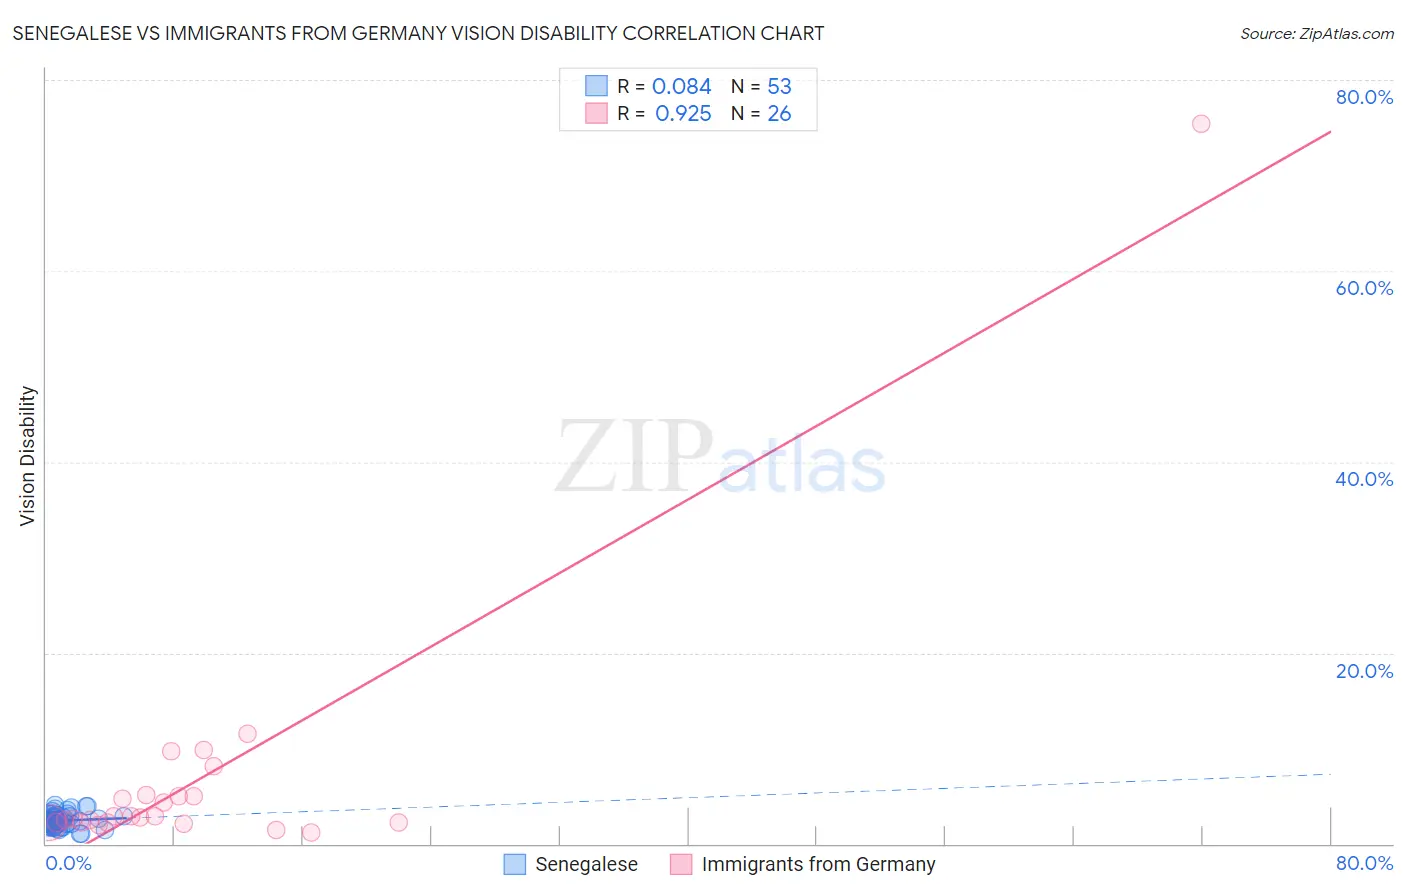
Senegalese vs Immigrants from Germany Vision Disability Correlation Chart
The statistical analysis conducted on geographies consisting of 78,129,878 people shows a slight positive correlation between the proportion of Senegalese and percentage of population with vision disability in the United States with a correlation coefficient (R) of 0.084 and weighted average of 2.4%. Similarly, the statistical analysis conducted on geographies consisting of 463,372,189 people shows a near-perfect positive correlation between the proportion of Immigrants from Germany and percentage of population with vision disability in the United States with a correlation coefficient (R) of 0.925 and weighted average of 2.3%, a difference of 5.1%.
Vision Disability Correlation Summary
| Measurement | Senegalese | Immigrants from Germany |
| Minimum | 1.0% | 1.2% |
| Maximum | 4.0% | 75.4% |
| Range | 3.0% | 74.2% |
| Mean | 2.4% | 6.8% |
| Median | 2.4% | 2.8% |
| Interquartile 25% (IQ1) | 1.9% | 2.2% |
| Interquartile 75% (IQ3) | 2.9% | 5.0% |
| Interquartile Range (IQR) | 0.95% | 2.8% |
| Standard Deviation (Sample) | 0.72% | 14.3% |
| Standard Deviation (Population) | 0.72% | 14.0% |
Similar Demographics by Vision Disability
Demographics Similar to Senegalese by Vision Disability
In terms of vision disability, the demographic groups most similar to Senegalese are Ute (2.4%, a difference of 0.090%), Mexican American Indian (2.4%, a difference of 0.10%), Immigrants from Jamaica (2.4%, a difference of 0.14%), Immigrants from Liberia (2.4%, a difference of 0.16%), and Celtic (2.4%, a difference of 0.27%).
| Demographics | Rating | Rank | Vision Disability |
| Fijians | 0.1 /100 | #261 | Tragic 2.4% |
| Jamaicans | 0.1 /100 | #262 | Tragic 2.4% |
| Immigrants | Belize | 0.1 /100 | #263 | Tragic 2.4% |
| Immigrants | Liberia | 0.1 /100 | #264 | Tragic 2.4% |
| Immigrants | Jamaica | 0.1 /100 | #265 | Tragic 2.4% |
| Mexican American Indians | 0.1 /100 | #266 | Tragic 2.4% |
| Ute | 0.1 /100 | #267 | Tragic 2.4% |
| Senegalese | 0.1 /100 | #268 | Tragic 2.4% |
| Celtics | 0.1 /100 | #269 | Tragic 2.4% |
| Cubans | 0.1 /100 | #270 | Tragic 2.4% |
| Immigrants | Azores | 0.1 /100 | #271 | Tragic 2.4% |
| Spaniards | 0.1 /100 | #272 | Tragic 2.4% |
| Immigrants | Bahamas | 0.1 /100 | #273 | Tragic 2.4% |
| Immigrants | Latin America | 0.0 /100 | #274 | Tragic 2.4% |
| Chippewa | 0.0 /100 | #275 | Tragic 2.4% |
Demographics Similar to Immigrants from Germany by Vision Disability
In terms of vision disability, the demographic groups most similar to Immigrants from Germany are Hawaiian (2.3%, a difference of 0.050%), Immigrants from Western Africa (2.3%, a difference of 0.22%), Irish (2.3%, a difference of 0.23%), Basque (2.3%, a difference of 0.26%), and Hmong (2.3%, a difference of 0.29%).
| Demographics | Rating | Rank | Vision Disability |
| Ecuadorians | 4.6 /100 | #219 | Tragic 2.3% |
| Guamanians/Chamorros | 3.9 /100 | #220 | Tragic 2.3% |
| French Canadians | 3.9 /100 | #221 | Tragic 2.3% |
| Immigrants | Senegal | 3.8 /100 | #222 | Tragic 2.3% |
| Basques | 3.5 /100 | #223 | Tragic 2.3% |
| Irish | 3.4 /100 | #224 | Tragic 2.3% |
| Immigrants | Western Africa | 3.4 /100 | #225 | Tragic 2.3% |
| Immigrants | Germany | 3.0 /100 | #226 | Tragic 2.3% |
| Hawaiians | 2.9 /100 | #227 | Tragic 2.3% |
| Hmong | 2.5 /100 | #228 | Tragic 2.3% |
| Welsh | 2.3 /100 | #229 | Tragic 2.3% |
| Nicaraguans | 2.2 /100 | #230 | Tragic 2.3% |
| Immigrants | Ecuador | 2.0 /100 | #231 | Tragic 2.3% |
| German Russians | 1.8 /100 | #232 | Tragic 2.3% |
| Central Americans | 1.8 /100 | #233 | Tragic 2.3% |