Senegalese vs Immigrants from Honduras Householder Income Under 25 years
COMPARE
Senegalese
Immigrants from Honduras
Householder Income Under 25 years
Householder Income Under 25 years Comparison
Senegalese
Immigrants from Honduras
$48,953
HOUSEHOLDER INCOME UNDER 25 YEARS
0.0/ 100
METRIC RATING
287th/ 347
METRIC RANK
$48,267
HOUSEHOLDER INCOME UNDER 25 YEARS
0.0/ 100
METRIC RATING
299th/ 347
METRIC RANK
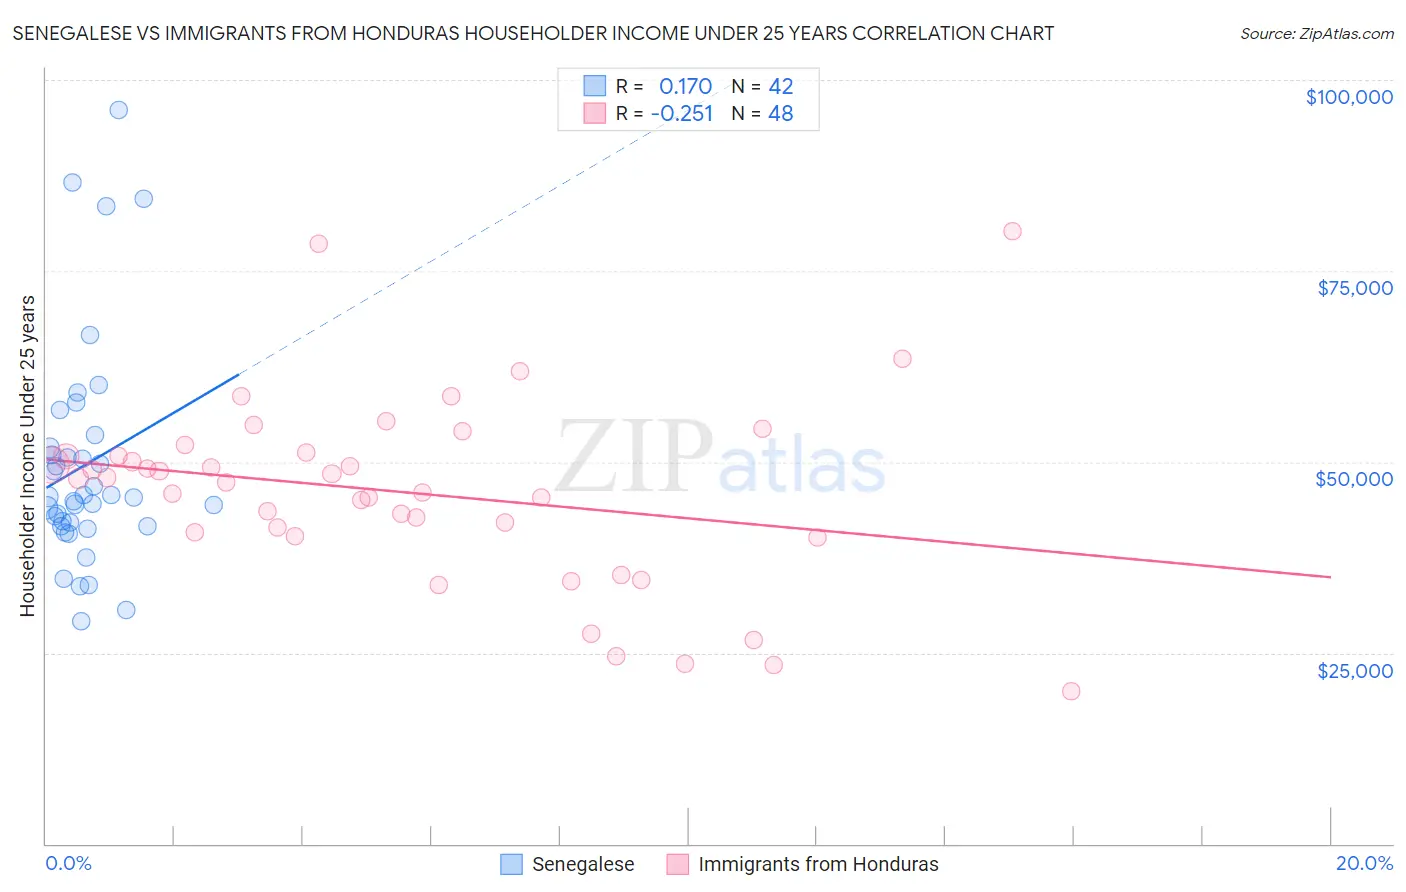
Senegalese vs Immigrants from Honduras Householder Income Under 25 years Correlation Chart
The statistical analysis conducted on geographies consisting of 74,236,071 people shows a poor positive correlation between the proportion of Senegalese and household income with householder under the age of 25 in the United States with a correlation coefficient (R) of 0.170 and weighted average of $48,953. Similarly, the statistical analysis conducted on geographies consisting of 280,925,483 people shows a weak negative correlation between the proportion of Immigrants from Honduras and household income with householder under the age of 25 in the United States with a correlation coefficient (R) of -0.251 and weighted average of $48,267, a difference of 1.4%.
Householder Income Under 25 years Correlation Summary
| Measurement | Senegalese | Immigrants from Honduras |
| Minimum | $29,051 | $19,963 |
| Maximum | $96,121 | $80,192 |
| Range | $67,070 | $60,229 |
| Mean | $49,594 | $45,959 |
| Median | $45,365 | $47,527 |
| Interquartile 25% (IQ1) | $41,620 | $40,556 |
| Interquartile 75% (IQ3) | $51,815 | $51,008 |
| Interquartile Range (IQR) | $10,195 | $10,452 |
| Standard Deviation (Sample) | $14,774 | $12,342 |
| Standard Deviation (Population) | $14,597 | $12,213 |
Demographics Similar to Senegalese and Immigrants from Honduras by Householder Income Under 25 years
In terms of householder income under 25 years, the demographic groups most similar to Senegalese are French American Indian ($48,977, a difference of 0.050%), Liberian ($48,917, a difference of 0.070%), Honduran ($48,885, a difference of 0.14%), Scotch-Irish ($49,039, a difference of 0.18%), and American ($48,860, a difference of 0.19%). Similarly, the demographic groups most similar to Immigrants from Honduras are Yaqui ($48,300, a difference of 0.070%), Immigrants from Somalia ($48,135, a difference of 0.27%), Immigrants from Kuwait ($48,126, a difference of 0.29%), Cree ($48,514, a difference of 0.51%), and Immigrants from Liberia ($47,981, a difference of 0.60%).
| Demographics | Rating | Rank | Householder Income Under 25 years |
| Immigrants | Nigeria | 0.1 /100 | #283 | Tragic $49,174 |
| Carpatho Rusyns | 0.1 /100 | #284 | Tragic $49,113 |
| Scotch-Irish | 0.0 /100 | #285 | Tragic $49,039 |
| French American Indians | 0.0 /100 | #286 | Tragic $48,977 |
| Senegalese | 0.0 /100 | #287 | Tragic $48,953 |
| Liberians | 0.0 /100 | #288 | Tragic $48,917 |
| Hondurans | 0.0 /100 | #289 | Tragic $48,885 |
| Americans | 0.0 /100 | #290 | Tragic $48,860 |
| Immigrants | Burma/Myanmar | 0.0 /100 | #291 | Tragic $48,749 |
| Shoshone | 0.0 /100 | #292 | Tragic $48,720 |
| Sub-Saharan Africans | 0.0 /100 | #293 | Tragic $48,691 |
| Somalis | 0.0 /100 | #294 | Tragic $48,657 |
| Central American Indians | 0.0 /100 | #295 | Tragic $48,643 |
| Blackfeet | 0.0 /100 | #296 | Tragic $48,603 |
| Cree | 0.0 /100 | #297 | Tragic $48,514 |
| Yaqui | 0.0 /100 | #298 | Tragic $48,300 |
| Immigrants | Honduras | 0.0 /100 | #299 | Tragic $48,267 |
| Immigrants | Somalia | 0.0 /100 | #300 | Tragic $48,135 |
| Immigrants | Kuwait | 0.0 /100 | #301 | Tragic $48,126 |
| Immigrants | Liberia | 0.0 /100 | #302 | Tragic $47,981 |
| Immigrants | Middle Africa | 0.0 /100 | #303 | Tragic $47,916 |