Senegalese vs Immigrants from Honduras 7th Grade
COMPARE
Senegalese
Immigrants from Honduras
7th Grade
7th Grade Comparison
Senegalese
Immigrants from Honduras
95.6%
7TH GRADE
4.0/ 100
METRIC RATING
231st/ 347
METRIC RANK
92.5%
7TH GRADE
0.0/ 100
METRIC RATING
336th/ 347
METRIC RANK
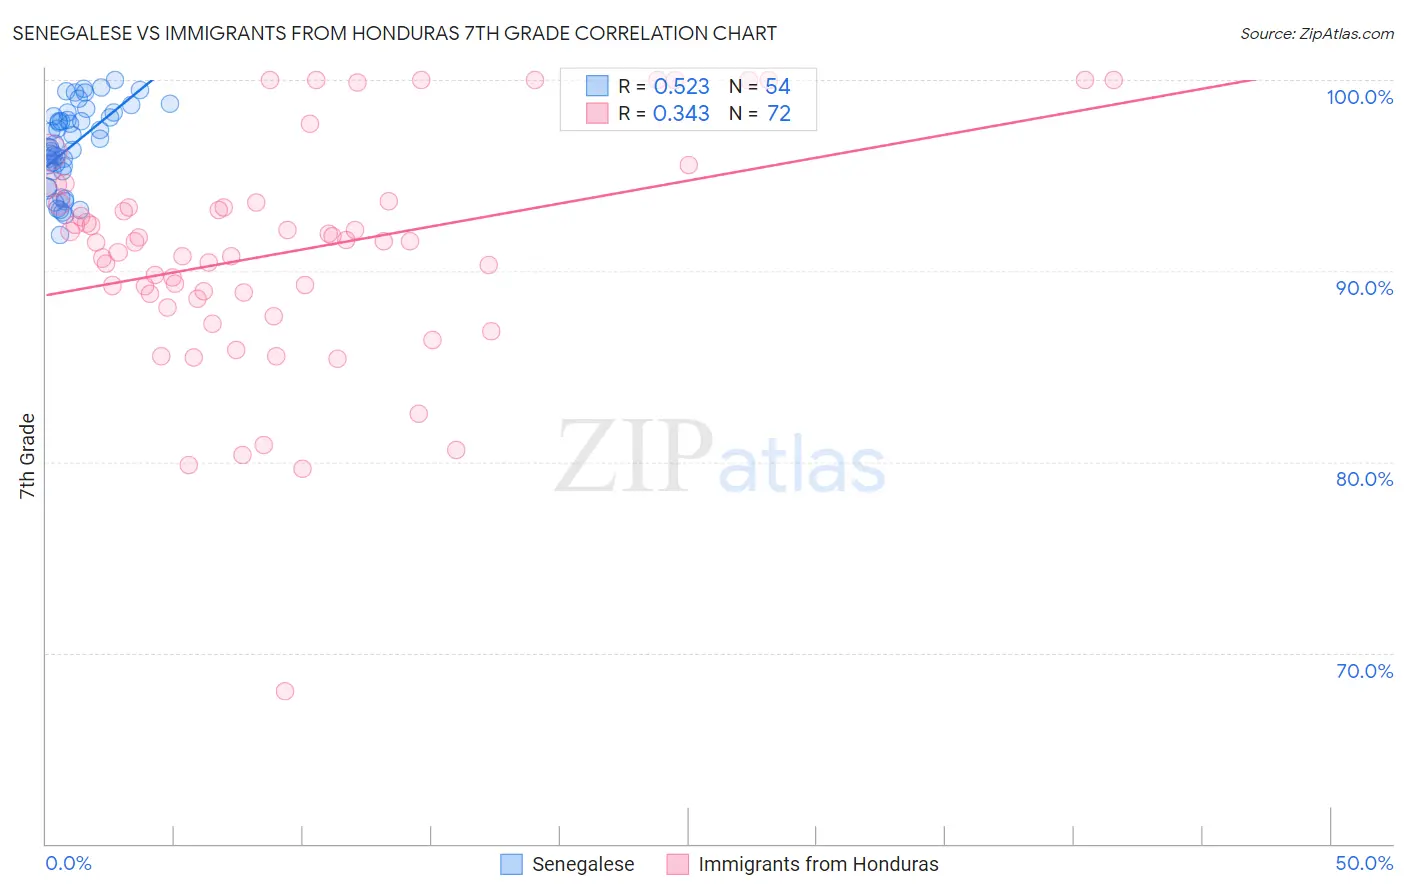
Senegalese vs Immigrants from Honduras 7th Grade Correlation Chart
The statistical analysis conducted on geographies consisting of 78,142,569 people shows a substantial positive correlation between the proportion of Senegalese and percentage of population with at least 7th grade education in the United States with a correlation coefficient (R) of 0.523 and weighted average of 95.6%. Similarly, the statistical analysis conducted on geographies consisting of 322,637,445 people shows a mild positive correlation between the proportion of Immigrants from Honduras and percentage of population with at least 7th grade education in the United States with a correlation coefficient (R) of 0.343 and weighted average of 92.5%, a difference of 3.3%.
7th Grade Correlation Summary
| Measurement | Senegalese | Immigrants from Honduras |
| Minimum | 91.9% | 68.0% |
| Maximum | 100.0% | 100.0% |
| Range | 8.1% | 32.0% |
| Mean | 96.5% | 91.0% |
| Median | 96.6% | 91.6% |
| Interquartile 25% (IQ1) | 95.2% | 88.7% |
| Interquartile 75% (IQ3) | 98.1% | 93.5% |
| Interquartile Range (IQR) | 2.9% | 4.9% |
| Standard Deviation (Sample) | 2.1% | 5.9% |
| Standard Deviation (Population) | 2.1% | 5.9% |
Similar Demographics by 7th Grade
Demographics Similar to Senegalese by 7th Grade
In terms of 7th grade, the demographic groups most similar to Senegalese are Native/Alaskan (95.6%, a difference of 0.010%), Immigrants from Panama (95.6%, a difference of 0.030%), Costa Rican (95.5%, a difference of 0.030%), Immigrants from Indonesia (95.5%, a difference of 0.030%), and Immigrants from Eastern Africa (95.6%, a difference of 0.040%).
| Demographics | Rating | Rank | 7th Grade |
| Immigrants | Oceania | 6.7 /100 | #224 | Tragic 95.7% |
| Immigrants | Malaysia | 6.2 /100 | #225 | Tragic 95.6% |
| Immigrants | Eastern Asia | 5.8 /100 | #226 | Tragic 95.6% |
| Immigrants | Western Asia | 5.4 /100 | #227 | Tragic 95.6% |
| Immigrants | Eastern Africa | 5.1 /100 | #228 | Tragic 95.6% |
| Immigrants | Panama | 4.9 /100 | #229 | Tragic 95.6% |
| Natives/Alaskans | 4.2 /100 | #230 | Tragic 95.6% |
| Senegalese | 4.0 /100 | #231 | Tragic 95.6% |
| Costa Ricans | 3.3 /100 | #232 | Tragic 95.5% |
| Immigrants | Indonesia | 3.3 /100 | #233 | Tragic 95.5% |
| Nigerians | 3.0 /100 | #234 | Tragic 95.5% |
| Immigrants | Africa | 2.7 /100 | #235 | Tragic 95.5% |
| Asians | 2.6 /100 | #236 | Tragic 95.5% |
| Immigrants | Asia | 2.3 /100 | #237 | Tragic 95.5% |
| Indians (Asian) | 2.3 /100 | #238 | Tragic 95.5% |
Demographics Similar to Immigrants from Honduras by 7th Grade
In terms of 7th grade, the demographic groups most similar to Immigrants from Honduras are Mexican American Indian (92.6%, a difference of 0.070%), Immigrants from Yemen (92.6%, a difference of 0.17%), Immigrants from Armenia (92.7%, a difference of 0.25%), Hispanic or Latino (92.7%, a difference of 0.27%), and Immigrants from Latin America (92.2%, a difference of 0.27%).
| Demographics | Rating | Rank | 7th Grade |
| Immigrants | Azores | 0.0 /100 | #329 | Tragic 93.0% |
| Immigrants | Dominican Republic | 0.0 /100 | #330 | Tragic 92.9% |
| Hondurans | 0.0 /100 | #331 | Tragic 92.9% |
| Hispanics or Latinos | 0.0 /100 | #332 | Tragic 92.7% |
| Immigrants | Armenia | 0.0 /100 | #333 | Tragic 92.7% |
| Immigrants | Yemen | 0.0 /100 | #334 | Tragic 92.6% |
| Mexican American Indians | 0.0 /100 | #335 | Tragic 92.6% |
| Immigrants | Honduras | 0.0 /100 | #336 | Tragic 92.5% |
| Immigrants | Latin America | 0.0 /100 | #337 | Tragic 92.2% |
| Central Americans | 0.0 /100 | #338 | Tragic 92.1% |
| Mexicans | 0.0 /100 | #339 | Tragic 91.9% |
| Yakama | 0.0 /100 | #340 | Tragic 91.7% |
| Guatemalans | 0.0 /100 | #341 | Tragic 91.7% |
| Salvadorans | 0.0 /100 | #342 | Tragic 91.5% |
| Immigrants | Guatemala | 0.0 /100 | #343 | Tragic 91.3% |