Senegalese vs Immigrants from Burma/Myanmar Disability Age 18 to 34
COMPARE
Senegalese
Immigrants from Burma/Myanmar
Disability Age 18 to 34
Disability Age 18 to 34 Comparison
Senegalese
Immigrants from Burma/Myanmar
6.9%
DISABILITY AGE 18 TO 34
4.9/ 100
METRIC RATING
224th/ 347
METRIC RANK
6.8%
DISABILITY AGE 18 TO 34
12.3/ 100
METRIC RATING
209th/ 347
METRIC RANK
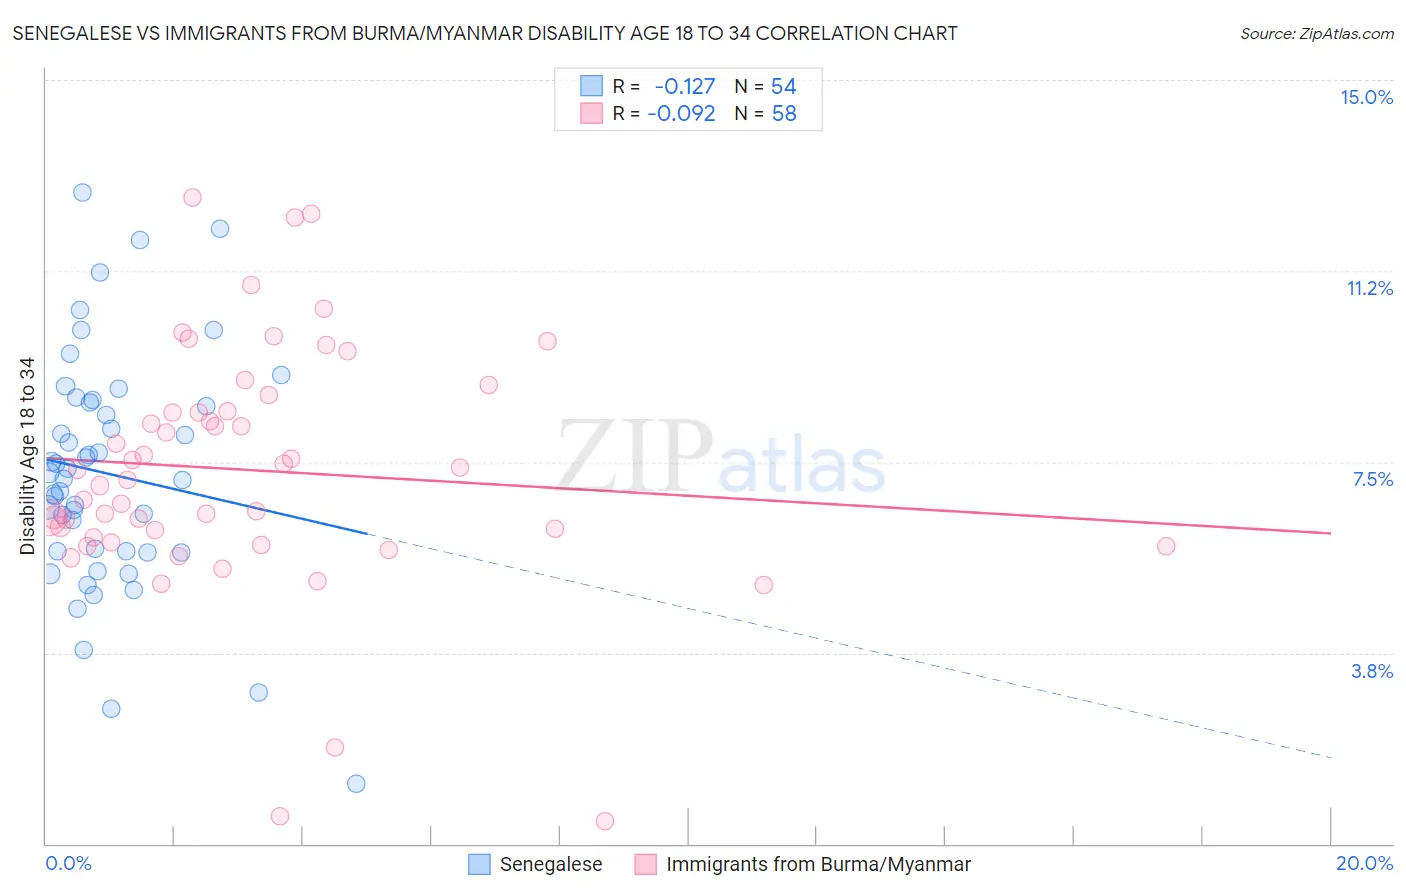
Senegalese vs Immigrants from Burma/Myanmar Disability Age 18 to 34 Correlation Chart
The statistical analysis conducted on geographies consisting of 78,132,193 people shows a poor negative correlation between the proportion of Senegalese and percentage of population with a disability between the ages 18 and 35 in the United States with a correlation coefficient (R) of -0.127 and weighted average of 6.9%. Similarly, the statistical analysis conducted on geographies consisting of 172,278,833 people shows a slight negative correlation between the proportion of Immigrants from Burma/Myanmar and percentage of population with a disability between the ages 18 and 35 in the United States with a correlation coefficient (R) of -0.092 and weighted average of 6.8%, a difference of 1.7%.
Disability Age 18 to 34 Correlation Summary
| Measurement | Senegalese | Immigrants from Burma/Myanmar |
| Minimum | 1.2% | 0.44% |
| Maximum | 12.8% | 12.7% |
| Range | 11.6% | 12.2% |
| Mean | 7.3% | 7.3% |
| Median | 7.2% | 7.2% |
| Interquartile 25% (IQ1) | 5.7% | 6.0% |
| Interquartile 75% (IQ3) | 8.7% | 8.5% |
| Interquartile Range (IQR) | 2.9% | 2.5% |
| Standard Deviation (Sample) | 2.3% | 2.4% |
| Standard Deviation (Population) | 2.3% | 2.4% |
Demographics Similar to Senegalese and Immigrants from Burma/Myanmar by Disability Age 18 to 34
In terms of disability age 18 to 34, the demographic groups most similar to Senegalese are Carpatho Rusyn (6.9%, a difference of 0.090%), Central American Indian (6.9%, a difference of 0.090%), Immigrants from England (6.9%, a difference of 0.12%), Immigrants from Middle Africa (6.9%, a difference of 0.19%), and Ugandan (6.9%, a difference of 0.19%). Similarly, the demographic groups most similar to Immigrants from Burma/Myanmar are Immigrants from Scotland (6.8%, a difference of 0.020%), Mexican (6.8%, a difference of 0.040%), Japanese (6.8%, a difference of 0.080%), Latvian (6.8%, a difference of 0.20%), and Immigrants from Norway (6.8%, a difference of 0.39%).
| Demographics | Rating | Rank | Disability Age 18 to 34 |
| Japanese | 12.8 /100 | #206 | Poor 6.8% |
| Mexicans | 12.6 /100 | #207 | Poor 6.8% |
| Immigrants | Scotland | 12.4 /100 | #208 | Poor 6.8% |
| Immigrants | Burma/Myanmar | 12.3 /100 | #209 | Poor 6.8% |
| Latvians | 11.1 /100 | #210 | Poor 6.8% |
| Immigrants | Norway | 10.0 /100 | #211 | Tragic 6.8% |
| Luxembourgers | 9.4 /100 | #212 | Tragic 6.9% |
| Immigrants | Western Europe | 9.1 /100 | #213 | Tragic 6.9% |
| Serbians | 8.2 /100 | #214 | Tragic 6.9% |
| Immigrants | Thailand | 7.5 /100 | #215 | Tragic 6.9% |
| Sudanese | 7.0 /100 | #216 | Tragic 6.9% |
| Immigrants | Kenya | 6.9 /100 | #217 | Tragic 6.9% |
| Ukrainians | 6.7 /100 | #218 | Tragic 6.9% |
| Hawaiians | 6.5 /100 | #219 | Tragic 6.9% |
| Immigrants | Senegal | 5.5 /100 | #220 | Tragic 6.9% |
| Immigrants | Middle Africa | 5.5 /100 | #221 | Tragic 6.9% |
| Immigrants | England | 5.3 /100 | #222 | Tragic 6.9% |
| Carpatho Rusyns | 5.2 /100 | #223 | Tragic 6.9% |
| Senegalese | 4.9 /100 | #224 | Tragic 6.9% |
| Central American Indians | 4.7 /100 | #225 | Tragic 6.9% |
| Ugandans | 4.4 /100 | #226 | Tragic 6.9% |