Seminole vs Immigrants from El Salvador Bachelor's Degree
COMPARE
Seminole
Immigrants from El Salvador
Bachelor's Degree
Bachelor's Degree Comparison
Seminole
Immigrants from El Salvador
29.4%
BACHELOR'S DEGREE
0.0/ 100
METRIC RATING
312th/ 347
METRIC RANK
31.3%
BACHELOR'S DEGREE
0.1/ 100
METRIC RATING
286th/ 347
METRIC RANK
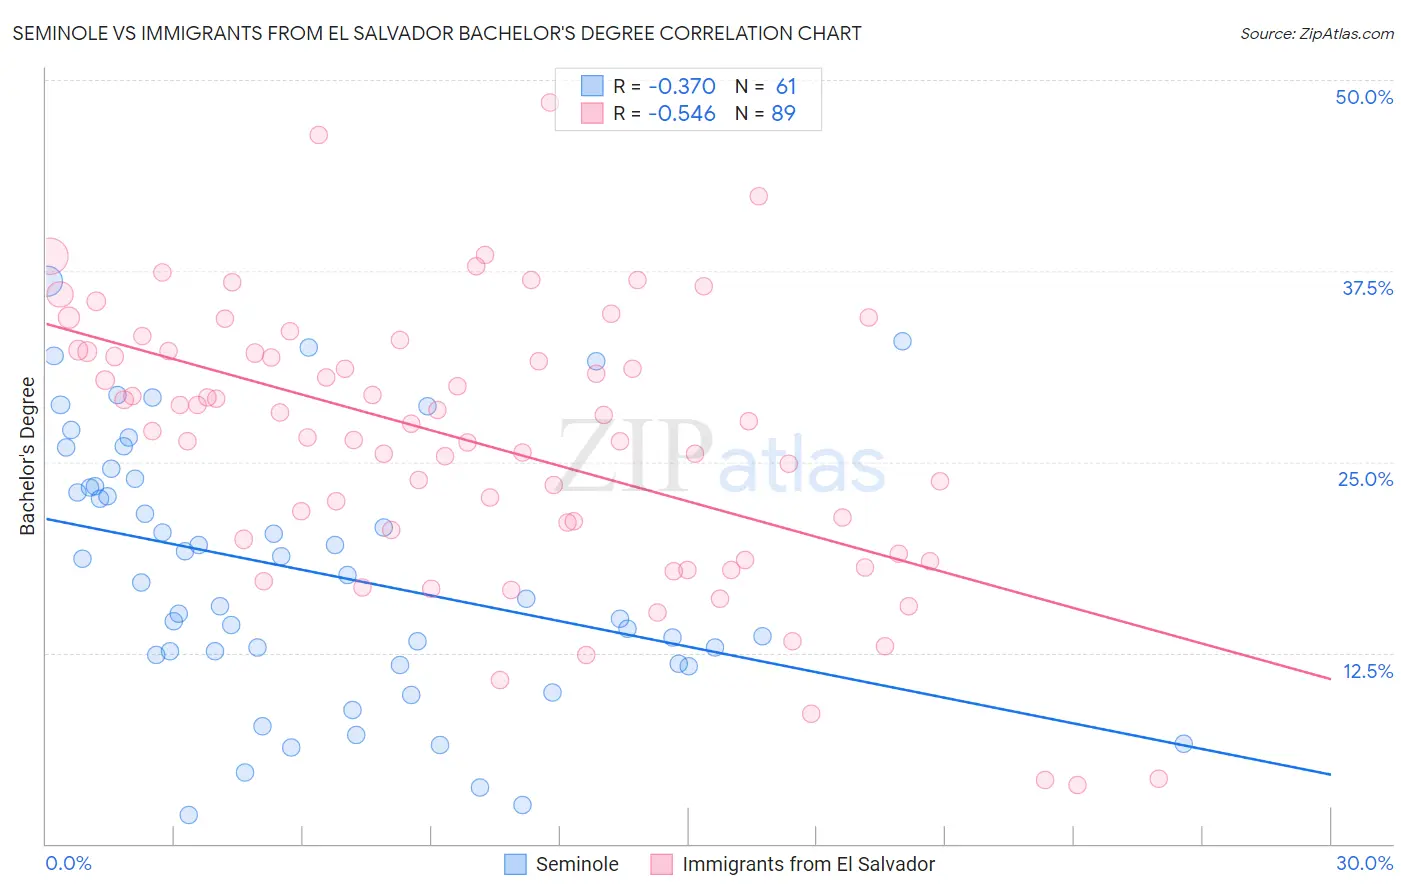
Seminole vs Immigrants from El Salvador Bachelor's Degree Correlation Chart
The statistical analysis conducted on geographies consisting of 118,312,408 people shows a mild negative correlation between the proportion of Seminole and percentage of population with at least bachelor's degree education in the United States with a correlation coefficient (R) of -0.370 and weighted average of 29.4%. Similarly, the statistical analysis conducted on geographies consisting of 357,832,054 people shows a substantial negative correlation between the proportion of Immigrants from El Salvador and percentage of population with at least bachelor's degree education in the United States with a correlation coefficient (R) of -0.546 and weighted average of 31.3%, a difference of 6.5%.
Bachelor's Degree Correlation Summary
| Measurement | Seminole | Immigrants from El Salvador |
| Minimum | 1.9% | 3.9% |
| Maximum | 36.8% | 48.5% |
| Range | 34.9% | 44.6% |
| Mean | 17.7% | 26.3% |
| Median | 17.1% | 27.5% |
| Interquartile 25% (IQ1) | 12.1% | 19.4% |
| Interquartile 75% (IQ3) | 23.6% | 32.2% |
| Interquartile Range (IQR) | 11.6% | 12.8% |
| Standard Deviation (Sample) | 8.5% | 9.0% |
| Standard Deviation (Population) | 8.4% | 8.9% |
Similar Demographics by Bachelor's Degree
Demographics Similar to Seminole by Bachelor's Degree
In terms of bachelor's degree, the demographic groups most similar to Seminole are Choctaw (29.4%, a difference of 0.060%), Cheyenne (29.4%, a difference of 0.13%), Alaska Native (29.4%, a difference of 0.18%), Shoshone (29.3%, a difference of 0.48%), and Immigrants from Cabo Verde (29.2%, a difference of 0.56%).
| Demographics | Rating | Rank | Bachelor's Degree |
| Immigrants | Latin America | 0.0 /100 | #305 | Tragic 30.1% |
| Immigrants | Yemen | 0.0 /100 | #306 | Tragic 29.9% |
| Nepalese | 0.0 /100 | #307 | Tragic 29.9% |
| Cajuns | 0.0 /100 | #308 | Tragic 29.6% |
| Hispanics or Latinos | 0.0 /100 | #309 | Tragic 29.6% |
| Cheyenne | 0.0 /100 | #310 | Tragic 29.4% |
| Choctaw | 0.0 /100 | #311 | Tragic 29.4% |
| Seminole | 0.0 /100 | #312 | Tragic 29.4% |
| Alaska Natives | 0.0 /100 | #313 | Tragic 29.4% |
| Shoshone | 0.0 /100 | #314 | Tragic 29.3% |
| Immigrants | Cabo Verde | 0.0 /100 | #315 | Tragic 29.2% |
| Sioux | 0.0 /100 | #316 | Tragic 29.1% |
| Colville | 0.0 /100 | #317 | Tragic 29.0% |
| Yaqui | 0.0 /100 | #318 | Tragic 29.0% |
| Creek | 0.0 /100 | #319 | Tragic 28.9% |
Demographics Similar to Immigrants from El Salvador by Bachelor's Degree
In terms of bachelor's degree, the demographic groups most similar to Immigrants from El Salvador are Aleut (31.3%, a difference of 0.050%), Haitian (31.3%, a difference of 0.070%), Honduran (31.3%, a difference of 0.10%), Immigrants from Caribbean (31.4%, a difference of 0.38%), and Blackfeet (31.5%, a difference of 0.52%).
| Demographics | Rating | Rank | Bachelor's Degree |
| Hawaiians | 0.1 /100 | #279 | Tragic 31.6% |
| Immigrants | Laos | 0.1 /100 | #280 | Tragic 31.6% |
| Blackfeet | 0.1 /100 | #281 | Tragic 31.5% |
| Immigrants | Caribbean | 0.1 /100 | #282 | Tragic 31.4% |
| Hondurans | 0.1 /100 | #283 | Tragic 31.3% |
| Haitians | 0.1 /100 | #284 | Tragic 31.3% |
| Aleuts | 0.1 /100 | #285 | Tragic 31.3% |
| Immigrants | El Salvador | 0.1 /100 | #286 | Tragic 31.3% |
| Ottawa | 0.1 /100 | #287 | Tragic 31.1% |
| Guatemalans | 0.1 /100 | #288 | Tragic 31.0% |
| Puerto Ricans | 0.1 /100 | #289 | Tragic 31.0% |
| Immigrants | Honduras | 0.1 /100 | #290 | Tragic 30.9% |
| Blacks/African Americans | 0.1 /100 | #291 | Tragic 30.9% |
| Ute | 0.1 /100 | #292 | Tragic 30.9% |
| Cape Verdeans | 0.1 /100 | #293 | Tragic 30.9% |