Seminole vs Guatemalan Cognitive Disability
COMPARE
Seminole
Guatemalan
Cognitive Disability
Cognitive Disability Comparison
Seminole
Guatemalans
18.3%
COGNITIVE DISABILITY
0.0/ 100
METRIC RATING
306th/ 347
METRIC RANK
17.8%
COGNITIVE DISABILITY
2.1/ 100
METRIC RATING
231st/ 347
METRIC RANK
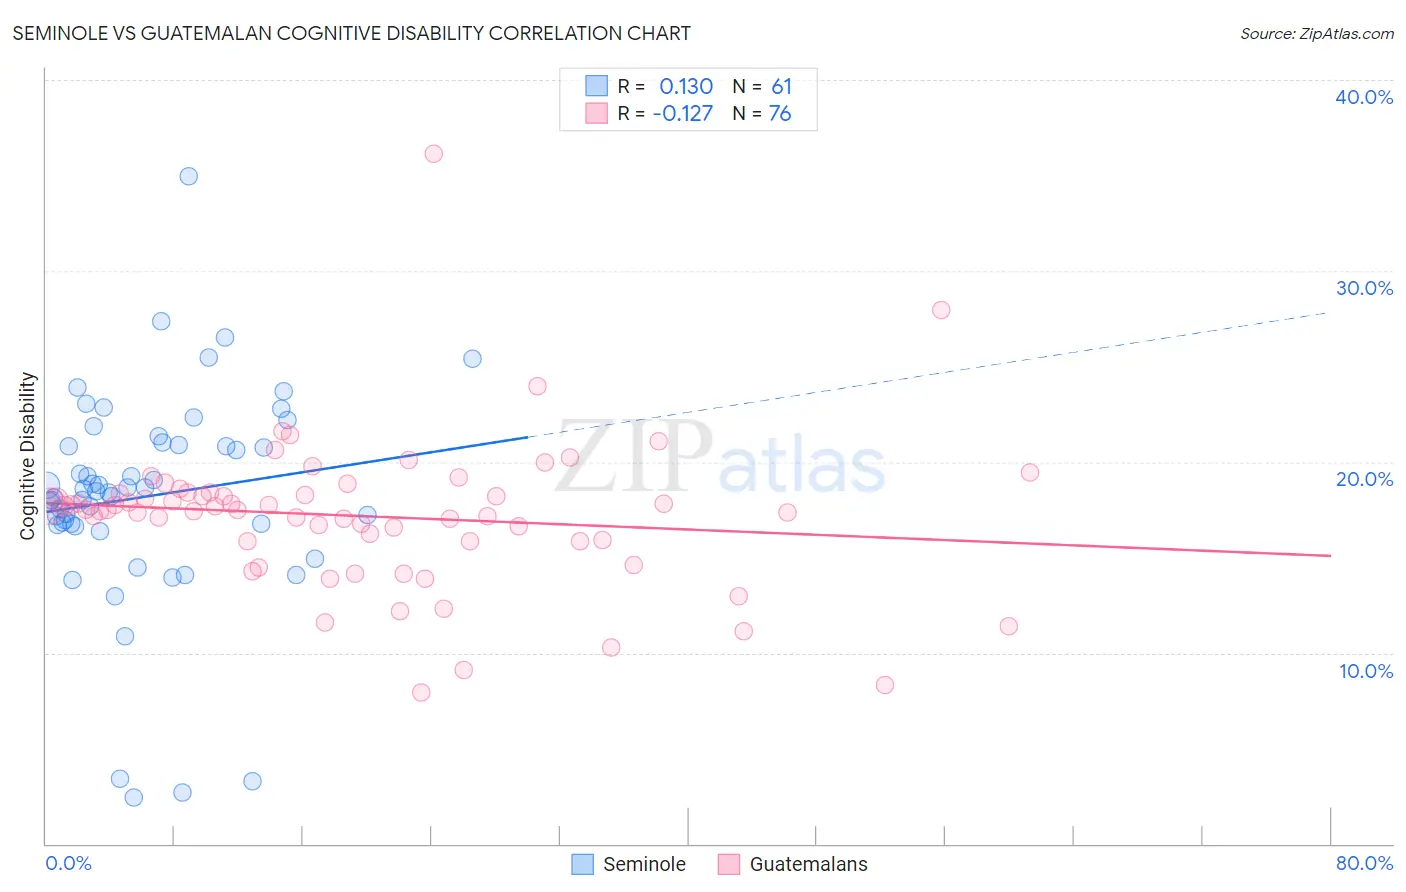
Seminole vs Guatemalan Cognitive Disability Correlation Chart
The statistical analysis conducted on geographies consisting of 118,309,503 people shows a poor positive correlation between the proportion of Seminole and percentage of population with cognitive disability in the United States with a correlation coefficient (R) of 0.130 and weighted average of 18.3%. Similarly, the statistical analysis conducted on geographies consisting of 409,490,798 people shows a poor negative correlation between the proportion of Guatemalans and percentage of population with cognitive disability in the United States with a correlation coefficient (R) of -0.127 and weighted average of 17.8%, a difference of 3.3%.
Cognitive Disability Correlation Summary
| Measurement | Seminole | Guatemalan |
| Minimum | 2.4% | 7.9% |
| Maximum | 35.0% | 36.1% |
| Range | 32.5% | 28.2% |
| Mean | 18.2% | 17.2% |
| Median | 18.5% | 17.5% |
| Interquartile 25% (IQ1) | 16.7% | 15.9% |
| Interquartile 75% (IQ3) | 21.0% | 18.4% |
| Interquartile Range (IQR) | 4.2% | 2.5% |
| Standard Deviation (Sample) | 5.6% | 3.9% |
| Standard Deviation (Population) | 5.6% | 3.9% |
Similar Demographics by Cognitive Disability
Demographics Similar to Seminole by Cognitive Disability
In terms of cognitive disability, the demographic groups most similar to Seminole are Ugandan (18.3%, a difference of 0.0%), Colville (18.3%, a difference of 0.010%), Immigrants from Western Africa (18.4%, a difference of 0.090%), Immigrants from Eritrea (18.3%, a difference of 0.13%), and Immigrants from Eastern Africa (18.4%, a difference of 0.13%).
| Demographics | Rating | Rank | Cognitive Disability |
| Ghanaians | 0.0 /100 | #299 | Tragic 18.3% |
| Creek | 0.0 /100 | #300 | Tragic 18.3% |
| Immigrants | Ghana | 0.0 /100 | #301 | Tragic 18.3% |
| Barbadians | 0.0 /100 | #302 | Tragic 18.3% |
| Immigrants | Kenya | 0.0 /100 | #303 | Tragic 18.3% |
| Immigrants | Eritrea | 0.0 /100 | #304 | Tragic 18.3% |
| Colville | 0.0 /100 | #305 | Tragic 18.3% |
| Seminole | 0.0 /100 | #306 | Tragic 18.3% |
| Ugandans | 0.0 /100 | #307 | Tragic 18.3% |
| Immigrants | Western Africa | 0.0 /100 | #308 | Tragic 18.4% |
| Immigrants | Eastern Africa | 0.0 /100 | #309 | Tragic 18.4% |
| Choctaw | 0.0 /100 | #310 | Tragic 18.4% |
| Hmong | 0.0 /100 | #311 | Tragic 18.4% |
| Chickasaw | 0.0 /100 | #312 | Tragic 18.5% |
| Yaqui | 0.0 /100 | #313 | Tragic 18.5% |
Demographics Similar to Guatemalans by Cognitive Disability
In terms of cognitive disability, the demographic groups most similar to Guatemalans are Tongan (17.8%, a difference of 0.0%), Panamanian (17.8%, a difference of 0.0%), Osage (17.8%, a difference of 0.020%), Spanish American Indian (17.8%, a difference of 0.020%), and Mongolian (17.7%, a difference of 0.030%).
| Demographics | Rating | Rank | Cognitive Disability |
| Fijians | 3.4 /100 | #224 | Tragic 17.7% |
| Vietnamese | 3.4 /100 | #225 | Tragic 17.7% |
| Marshallese | 2.7 /100 | #226 | Tragic 17.7% |
| Immigrants | St. Vincent and the Grenadines | 2.6 /100 | #227 | Tragic 17.7% |
| Immigrants | Central America | 2.3 /100 | #228 | Tragic 17.7% |
| Immigrants | Guatemala | 2.2 /100 | #229 | Tragic 17.7% |
| Mongolians | 2.2 /100 | #230 | Tragic 17.7% |
| Guatemalans | 2.1 /100 | #231 | Tragic 17.8% |
| Tongans | 2.1 /100 | #232 | Tragic 17.8% |
| Panamanians | 2.1 /100 | #233 | Tragic 17.8% |
| Osage | 2.0 /100 | #234 | Tragic 17.8% |
| Spanish American Indians | 2.0 /100 | #235 | Tragic 17.8% |
| Immigrants | Iraq | 1.8 /100 | #236 | Tragic 17.8% |
| Immigrants | Mexico | 1.8 /100 | #237 | Tragic 17.8% |
| Cheyenne | 1.7 /100 | #238 | Tragic 17.8% |