Seminole vs Immigrants from Argentina Vision Disability
COMPARE
Seminole
Immigrants from Argentina
Vision Disability
Vision Disability Comparison
Seminole
Immigrants from Argentina
3.1%
VISION DISABILITY
0.0/ 100
METRIC RATING
332nd/ 347
METRIC RANK
2.0%
VISION DISABILITY
98.9/ 100
METRIC RATING
66th/ 347
METRIC RANK
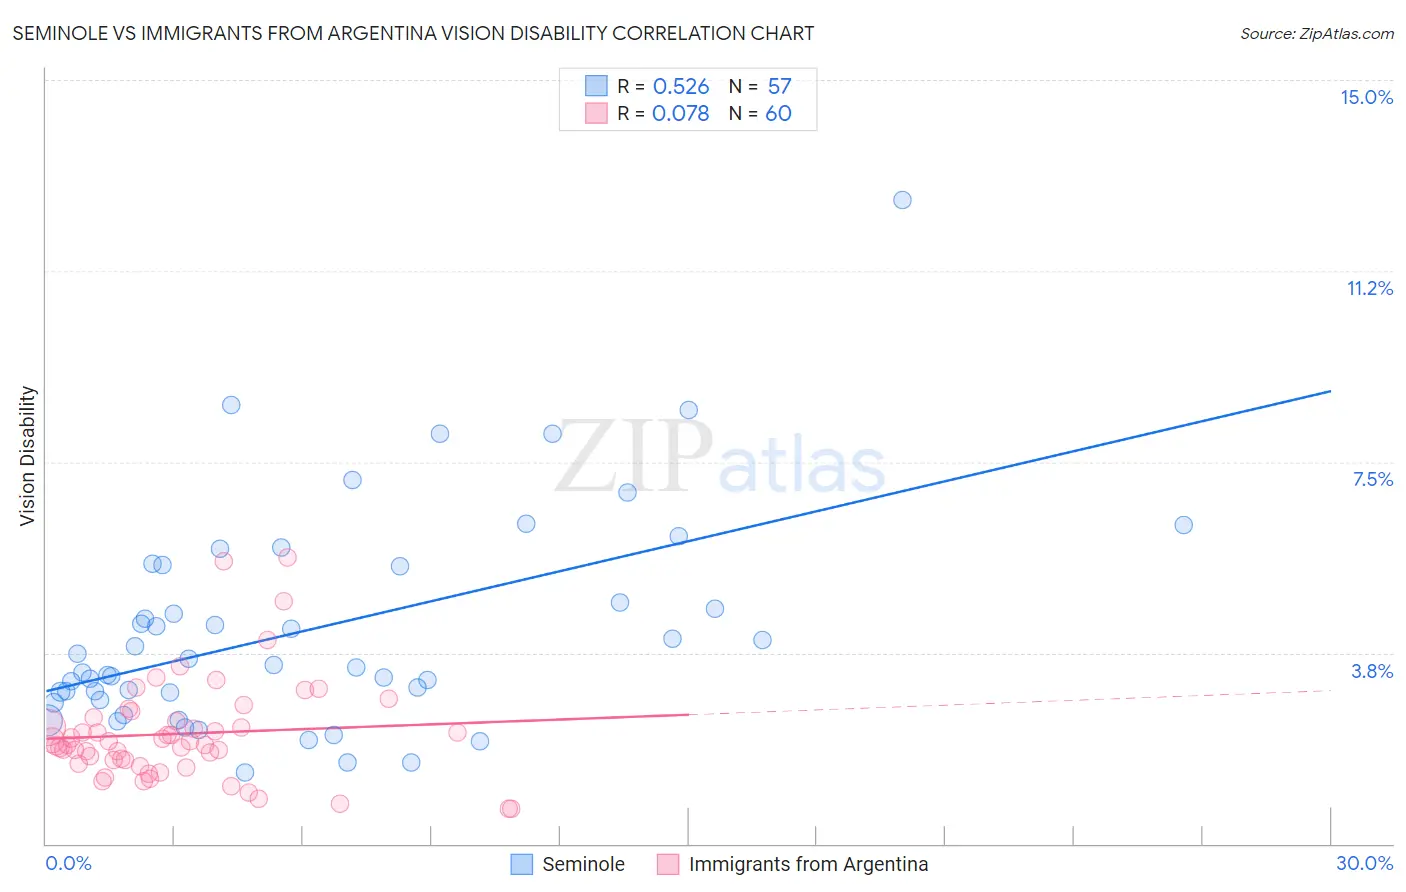
Seminole vs Immigrants from Argentina Vision Disability Correlation Chart
The statistical analysis conducted on geographies consisting of 118,301,889 people shows a substantial positive correlation between the proportion of Seminole and percentage of population with vision disability in the United States with a correlation coefficient (R) of 0.526 and weighted average of 3.1%. Similarly, the statistical analysis conducted on geographies consisting of 264,359,612 people shows a slight positive correlation between the proportion of Immigrants from Argentina and percentage of population with vision disability in the United States with a correlation coefficient (R) of 0.078 and weighted average of 2.0%, a difference of 51.9%.
Vision Disability Correlation Summary
| Measurement | Seminole | Immigrants from Argentina |
| Minimum | 1.4% | 0.68% |
| Maximum | 12.6% | 5.6% |
| Range | 11.2% | 4.9% |
| Mean | 4.2% | 2.2% |
| Median | 3.5% | 2.0% |
| Interquartile 25% (IQ1) | 2.9% | 1.6% |
| Interquartile 75% (IQ3) | 5.5% | 2.4% |
| Interquartile Range (IQR) | 2.6% | 0.82% |
| Standard Deviation (Sample) | 2.1% | 1.0% |
| Standard Deviation (Population) | 2.1% | 0.99% |
Similar Demographics by Vision Disability
Demographics Similar to Seminole by Vision Disability
In terms of vision disability, the demographic groups most similar to Seminole are Cajun (3.1%, a difference of 0.010%), Central American Indian (3.0%, a difference of 0.43%), Colville (3.0%, a difference of 1.1%), Cheyenne (3.1%, a difference of 1.1%), and Apache (3.0%, a difference of 2.3%).
| Demographics | Rating | Rank | Vision Disability |
| Cherokee | 0.0 /100 | #325 | Tragic 2.9% |
| Spanish Americans | 0.0 /100 | #326 | Tragic 2.9% |
| Natives/Alaskans | 0.0 /100 | #327 | Tragic 3.0% |
| Yuman | 0.0 /100 | #328 | Tragic 3.0% |
| Apache | 0.0 /100 | #329 | Tragic 3.0% |
| Colville | 0.0 /100 | #330 | Tragic 3.0% |
| Central American Indians | 0.0 /100 | #331 | Tragic 3.0% |
| Seminole | 0.0 /100 | #332 | Tragic 3.1% |
| Cajuns | 0.0 /100 | #333 | Tragic 3.1% |
| Cheyenne | 0.0 /100 | #334 | Tragic 3.1% |
| Navajo | 0.0 /100 | #335 | Tragic 3.1% |
| Alaskan Athabascans | 0.0 /100 | #336 | Tragic 3.1% |
| Dutch West Indians | 0.0 /100 | #337 | Tragic 3.2% |
| Chickasaw | 0.0 /100 | #338 | Tragic 3.2% |
| Tsimshian | 0.0 /100 | #339 | Tragic 3.2% |
Demographics Similar to Immigrants from Argentina by Vision Disability
In terms of vision disability, the demographic groups most similar to Immigrants from Argentina are Maltese (2.0%, a difference of 0.060%), Immigrants from Northern Africa (2.0%, a difference of 0.11%), Immigrants from Greece (2.0%, a difference of 0.13%), Immigrants from Czechoslovakia (2.0%, a difference of 0.21%), and Armenian (2.0%, a difference of 0.26%).
| Demographics | Rating | Rank | Vision Disability |
| Argentineans | 99.1 /100 | #59 | Exceptional 2.0% |
| Immigrants | Romania | 99.1 /100 | #60 | Exceptional 2.0% |
| Immigrants | Belgium | 99.1 /100 | #61 | Exceptional 2.0% |
| Immigrants | Russia | 99.1 /100 | #62 | Exceptional 2.0% |
| Armenians | 99.0 /100 | #63 | Exceptional 2.0% |
| Immigrants | Greece | 99.0 /100 | #64 | Exceptional 2.0% |
| Maltese | 98.9 /100 | #65 | Exceptional 2.0% |
| Immigrants | Argentina | 98.9 /100 | #66 | Exceptional 2.0% |
| Immigrants | Northern Africa | 98.8 /100 | #67 | Exceptional 2.0% |
| Immigrants | Czechoslovakia | 98.7 /100 | #68 | Exceptional 2.0% |
| Russians | 98.6 /100 | #69 | Exceptional 2.0% |
| Immigrants | Kazakhstan | 98.6 /100 | #70 | Exceptional 2.0% |
| Immigrants | Northern Europe | 98.6 /100 | #71 | Exceptional 2.0% |
| Immigrants | France | 98.5 /100 | #72 | Exceptional 2.0% |
| Immigrants | Eritrea | 98.4 /100 | #73 | Exceptional 2.0% |