Swedish vs Zimbabwean Cognitive Disability
COMPARE
Swedish
Zimbabwean
Cognitive Disability
Cognitive Disability Comparison
Swedes
Zimbabweans
16.5%
COGNITIVE DISABILITY
99.8/ 100
METRIC RATING
53rd/ 347
METRIC RANK
17.6%
COGNITIVE DISABILITY
6.1/ 100
METRIC RATING
220th/ 347
METRIC RANK
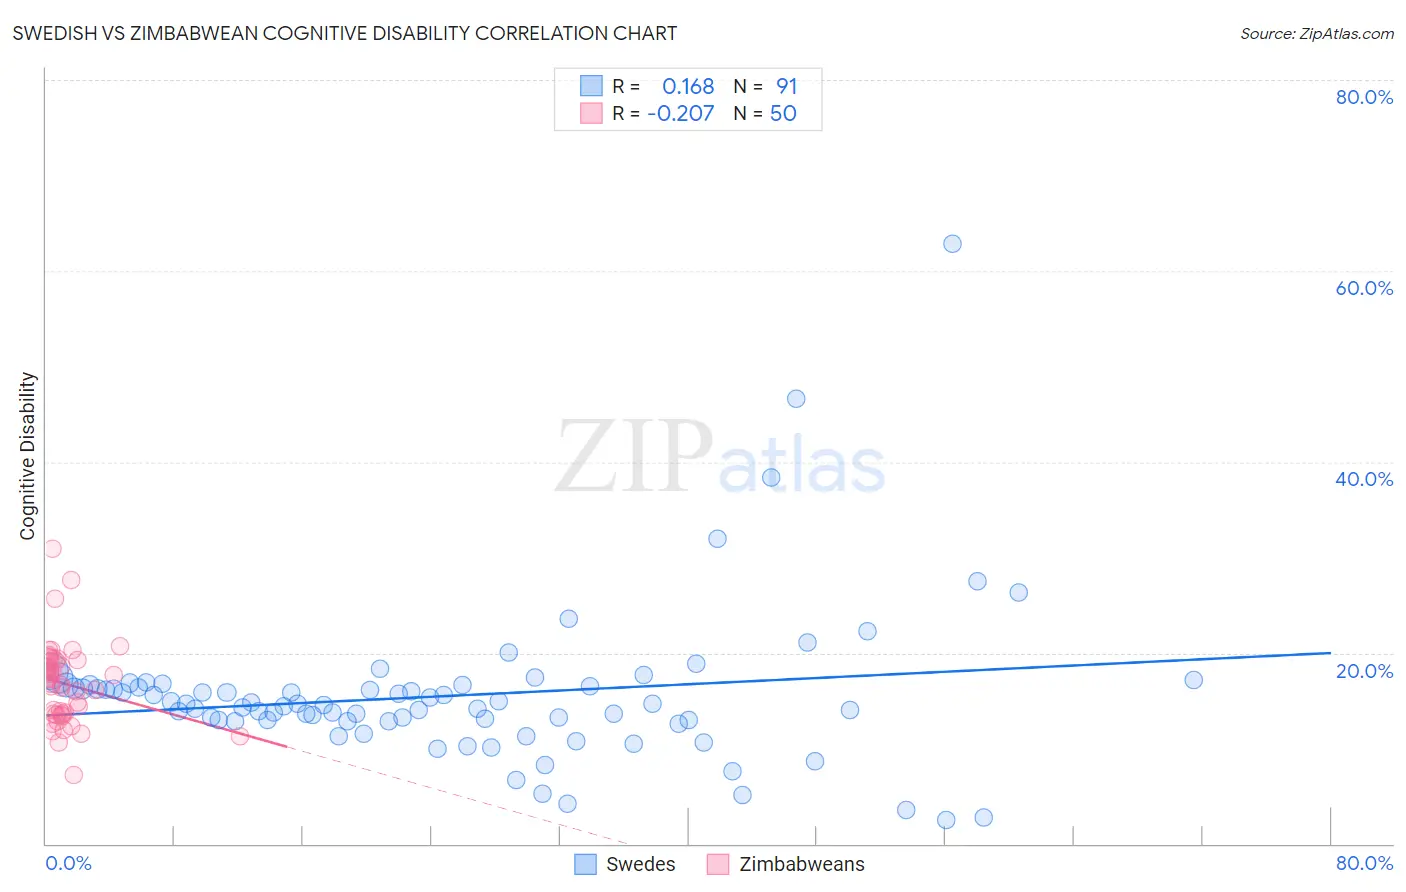
Swedish vs Zimbabwean Cognitive Disability Correlation Chart
The statistical analysis conducted on geographies consisting of 539,118,311 people shows a poor positive correlation between the proportion of Swedes and percentage of population with cognitive disability in the United States with a correlation coefficient (R) of 0.168 and weighted average of 16.5%. Similarly, the statistical analysis conducted on geographies consisting of 69,204,510 people shows a weak negative correlation between the proportion of Zimbabweans and percentage of population with cognitive disability in the United States with a correlation coefficient (R) of -0.207 and weighted average of 17.6%, a difference of 6.6%.
Cognitive Disability Correlation Summary
| Measurement | Swedish | Zimbabwean |
| Minimum | 2.5% | 7.2% |
| Maximum | 62.8% | 30.8% |
| Range | 60.2% | 23.7% |
| Mean | 15.5% | 16.8% |
| Median | 14.6% | 17.1% |
| Interquartile 25% (IQ1) | 12.9% | 13.6% |
| Interquartile 75% (IQ3) | 16.6% | 19.2% |
| Interquartile Range (IQR) | 3.7% | 5.6% |
| Standard Deviation (Sample) | 8.1% | 4.3% |
| Standard Deviation (Population) | 8.0% | 4.2% |
Similar Demographics by Cognitive Disability
Demographics Similar to Swedes by Cognitive Disability
In terms of cognitive disability, the demographic groups most similar to Swedes are Immigrants from Iran (16.5%, a difference of 0.040%), Soviet Union (16.5%, a difference of 0.060%), Immigrants from Korea (16.5%, a difference of 0.10%), Immigrants from Venezuela (16.5%, a difference of 0.13%), and Iranian (16.5%, a difference of 0.15%).
| Demographics | Rating | Rank | Cognitive Disability |
| Immigrants | Colombia | 99.8 /100 | #46 | Exceptional 16.5% |
| Immigrants | Italy | 99.8 /100 | #47 | Exceptional 16.5% |
| Immigrants | North America | 99.8 /100 | #48 | Exceptional 16.5% |
| Iranians | 99.8 /100 | #49 | Exceptional 16.5% |
| Norwegians | 99.8 /100 | #50 | Exceptional 16.5% |
| Immigrants | Korea | 99.8 /100 | #51 | Exceptional 16.5% |
| Soviet Union | 99.8 /100 | #52 | Exceptional 16.5% |
| Swedes | 99.8 /100 | #53 | Exceptional 16.5% |
| Immigrants | Iran | 99.8 /100 | #54 | Exceptional 16.5% |
| Immigrants | Venezuela | 99.7 /100 | #55 | Exceptional 16.5% |
| Austrians | 99.7 /100 | #56 | Exceptional 16.6% |
| Bhutanese | 99.7 /100 | #57 | Exceptional 16.6% |
| Pennsylvania Germans | 99.7 /100 | #58 | Exceptional 16.6% |
| Immigrants | Peru | 99.7 /100 | #59 | Exceptional 16.6% |
| Romanians | 99.7 /100 | #60 | Exceptional 16.6% |
Demographics Similar to Zimbabweans by Cognitive Disability
In terms of cognitive disability, the demographic groups most similar to Zimbabweans are Moroccan (17.6%, a difference of 0.020%), Immigrants from Sierra Leone (17.6%, a difference of 0.030%), Icelander (17.6%, a difference of 0.040%), Salvadoran (17.6%, a difference of 0.070%), and Okinawan (17.6%, a difference of 0.090%).
| Demographics | Rating | Rank | Cognitive Disability |
| Hawaiians | 7.2 /100 | #213 | Tragic 17.6% |
| Immigrants | El Salvador | 7.0 /100 | #214 | Tragic 17.6% |
| Alaskan Athabascans | 6.9 /100 | #215 | Tragic 17.6% |
| Okinawans | 6.8 /100 | #216 | Tragic 17.6% |
| Salvadorans | 6.7 /100 | #217 | Tragic 17.6% |
| Icelanders | 6.4 /100 | #218 | Tragic 17.6% |
| Immigrants | Sierra Leone | 6.3 /100 | #219 | Tragic 17.6% |
| Zimbabweans | 6.1 /100 | #220 | Tragic 17.6% |
| Moroccans | 5.9 /100 | #221 | Tragic 17.6% |
| Central Americans | 4.5 /100 | #222 | Tragic 17.7% |
| Alsatians | 4.5 /100 | #223 | Tragic 17.7% |
| Fijians | 3.4 /100 | #224 | Tragic 17.7% |
| Vietnamese | 3.4 /100 | #225 | Tragic 17.7% |
| Marshallese | 2.7 /100 | #226 | Tragic 17.7% |
| Immigrants | St. Vincent and the Grenadines | 2.6 /100 | #227 | Tragic 17.7% |