Jordanian vs Zimbabwean Cognitive Disability
COMPARE
Jordanian
Zimbabwean
Cognitive Disability
Cognitive Disability Comparison
Jordanians
Zimbabweans
16.8%
COGNITIVE DISABILITY
98.2/ 100
METRIC RATING
99th/ 347
METRIC RANK
17.6%
COGNITIVE DISABILITY
6.1/ 100
METRIC RATING
220th/ 347
METRIC RANK
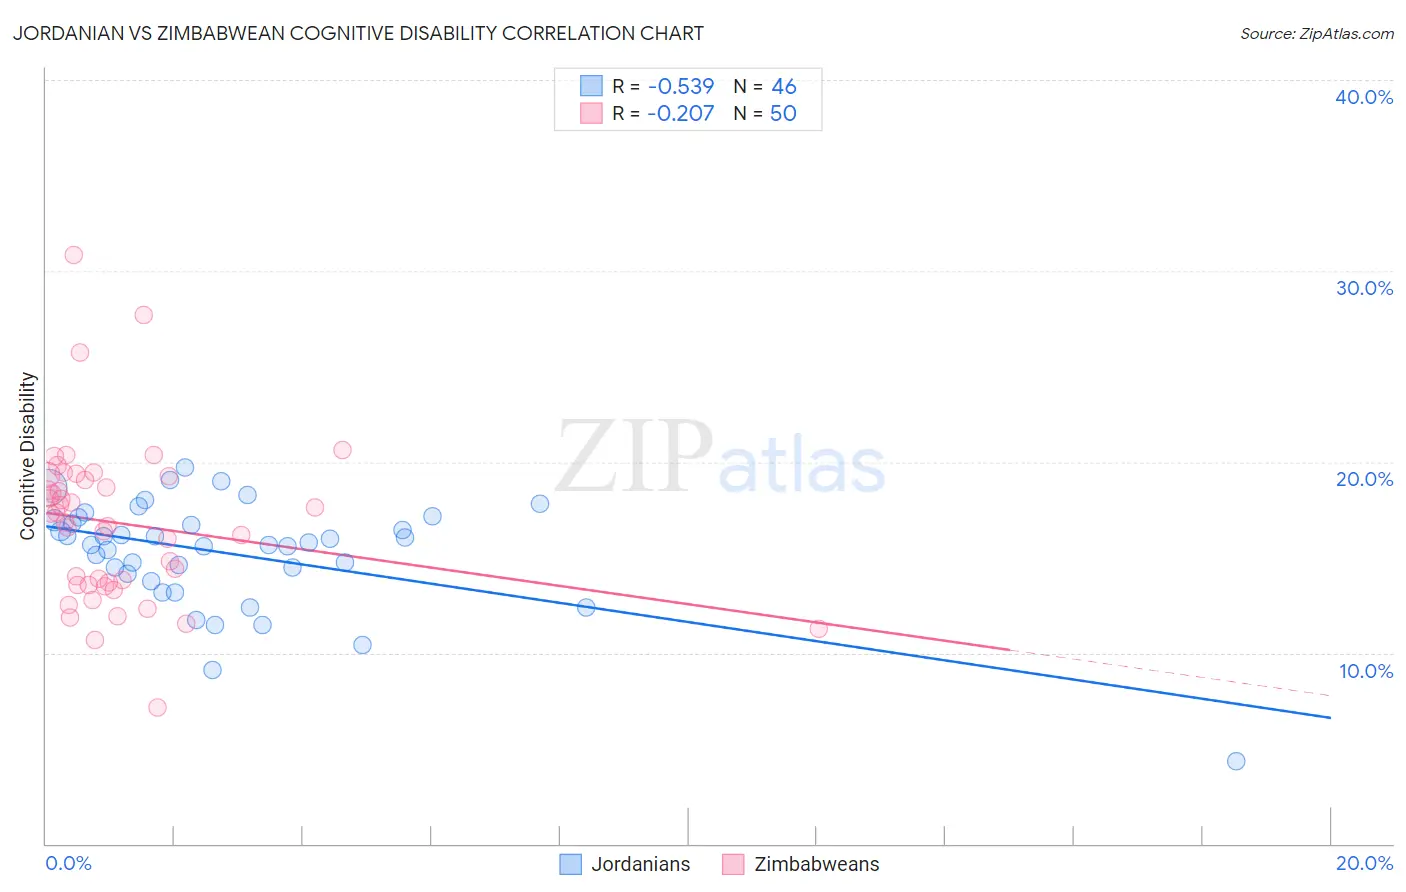
Jordanian vs Zimbabwean Cognitive Disability Correlation Chart
The statistical analysis conducted on geographies consisting of 166,416,373 people shows a substantial negative correlation between the proportion of Jordanians and percentage of population with cognitive disability in the United States with a correlation coefficient (R) of -0.539 and weighted average of 16.8%. Similarly, the statistical analysis conducted on geographies consisting of 69,204,510 people shows a weak negative correlation between the proportion of Zimbabweans and percentage of population with cognitive disability in the United States with a correlation coefficient (R) of -0.207 and weighted average of 17.6%, a difference of 5.0%.
Cognitive Disability Correlation Summary
| Measurement | Jordanian | Zimbabwean |
| Minimum | 4.3% | 7.2% |
| Maximum | 19.7% | 30.8% |
| Range | 15.3% | 23.7% |
| Mean | 15.2% | 16.8% |
| Median | 15.7% | 17.1% |
| Interquartile 25% (IQ1) | 14.1% | 13.6% |
| Interquartile 75% (IQ3) | 16.9% | 19.2% |
| Interquartile Range (IQR) | 2.8% | 5.6% |
| Standard Deviation (Sample) | 2.9% | 4.3% |
| Standard Deviation (Population) | 2.8% | 4.2% |
Similar Demographics by Cognitive Disability
Demographics Similar to Jordanians by Cognitive Disability
In terms of cognitive disability, the demographic groups most similar to Jordanians are Immigrants from Russia (16.8%, a difference of 0.030%), Immigrants from Asia (16.8%, a difference of 0.040%), Irish (16.8%, a difference of 0.060%), Immigrants from Lebanon (16.8%, a difference of 0.090%), and Dutch (16.8%, a difference of 0.11%).
| Demographics | Rating | Rank | Cognitive Disability |
| Immigrants | South America | 98.8 /100 | #92 | Exceptional 16.7% |
| Immigrants | Southern Europe | 98.7 /100 | #93 | Exceptional 16.7% |
| Asians | 98.7 /100 | #94 | Exceptional 16.7% |
| English | 98.6 /100 | #95 | Exceptional 16.8% |
| Finns | 98.5 /100 | #96 | Exceptional 16.8% |
| Dutch | 98.5 /100 | #97 | Exceptional 16.8% |
| Immigrants | Lebanon | 98.4 /100 | #98 | Exceptional 16.8% |
| Jordanians | 98.2 /100 | #99 | Exceptional 16.8% |
| Immigrants | Russia | 98.2 /100 | #100 | Exceptional 16.8% |
| Immigrants | Asia | 98.1 /100 | #101 | Exceptional 16.8% |
| Irish | 98.1 /100 | #102 | Exceptional 16.8% |
| Paraguayans | 98.0 /100 | #103 | Exceptional 16.8% |
| Palestinians | 98.0 /100 | #104 | Exceptional 16.8% |
| Immigrants | Eastern Asia | 97.9 /100 | #105 | Exceptional 16.8% |
| Northern Europeans | 97.8 /100 | #106 | Exceptional 16.8% |
Demographics Similar to Zimbabweans by Cognitive Disability
In terms of cognitive disability, the demographic groups most similar to Zimbabweans are Moroccan (17.6%, a difference of 0.020%), Immigrants from Sierra Leone (17.6%, a difference of 0.030%), Icelander (17.6%, a difference of 0.040%), Salvadoran (17.6%, a difference of 0.070%), and Okinawan (17.6%, a difference of 0.090%).
| Demographics | Rating | Rank | Cognitive Disability |
| Hawaiians | 7.2 /100 | #213 | Tragic 17.6% |
| Immigrants | El Salvador | 7.0 /100 | #214 | Tragic 17.6% |
| Alaskan Athabascans | 6.9 /100 | #215 | Tragic 17.6% |
| Okinawans | 6.8 /100 | #216 | Tragic 17.6% |
| Salvadorans | 6.7 /100 | #217 | Tragic 17.6% |
| Icelanders | 6.4 /100 | #218 | Tragic 17.6% |
| Immigrants | Sierra Leone | 6.3 /100 | #219 | Tragic 17.6% |
| Zimbabweans | 6.1 /100 | #220 | Tragic 17.6% |
| Moroccans | 5.9 /100 | #221 | Tragic 17.6% |
| Central Americans | 4.5 /100 | #222 | Tragic 17.7% |
| Alsatians | 4.5 /100 | #223 | Tragic 17.7% |
| Fijians | 3.4 /100 | #224 | Tragic 17.7% |
| Vietnamese | 3.4 /100 | #225 | Tragic 17.7% |
| Marshallese | 2.7 /100 | #226 | Tragic 17.7% |
| Immigrants | St. Vincent and the Grenadines | 2.6 /100 | #227 | Tragic 17.7% |