Scottish vs Argentinean Hearing Disability
COMPARE
Scottish
Argentinean
Hearing Disability
Hearing Disability Comparison
Scottish
Argentineans
3.7%
HEARING DISABILITY
0.0/ 100
METRIC RATING
300th/ 347
METRIC RANK
2.7%
HEARING DISABILITY
97.5/ 100
METRIC RATING
73rd/ 347
METRIC RANK
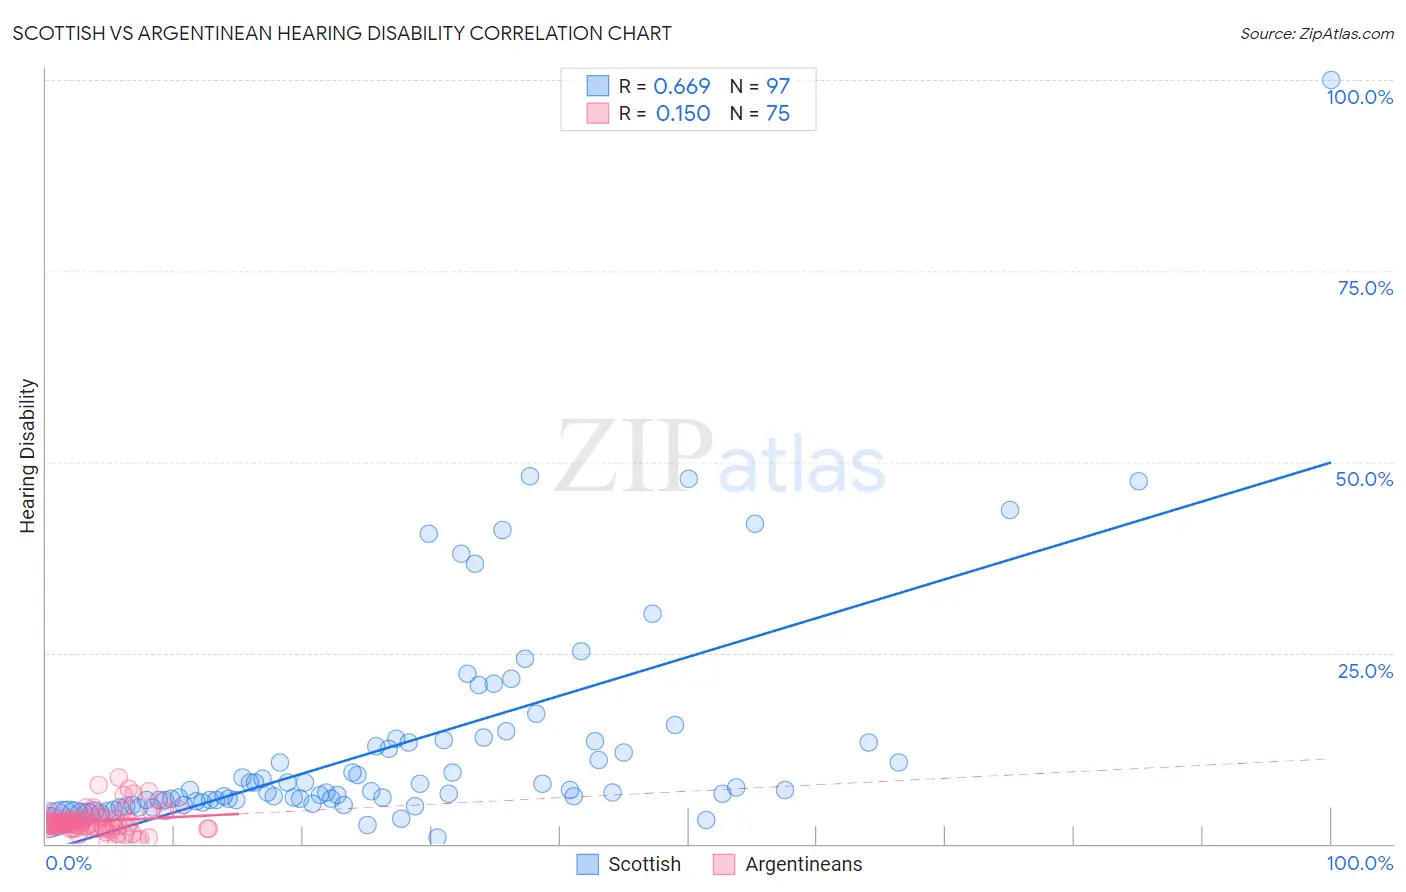
Scottish vs Argentinean Hearing Disability Correlation Chart
The statistical analysis conducted on geographies consisting of 566,483,062 people shows a significant positive correlation between the proportion of Scottish and percentage of population with hearing disability in the United States with a correlation coefficient (R) of 0.669 and weighted average of 3.7%. Similarly, the statistical analysis conducted on geographies consisting of 297,082,956 people shows a poor positive correlation between the proportion of Argentineans and percentage of population with hearing disability in the United States with a correlation coefficient (R) of 0.150 and weighted average of 2.7%, a difference of 36.5%.
Hearing Disability Correlation Summary
| Measurement | Scottish | Argentinean |
| Minimum | 0.87% | 0.15% |
| Maximum | 100.0% | 8.7% |
| Range | 99.1% | 8.6% |
| Mean | 12.6% | 3.0% |
| Median | 6.8% | 2.7% |
| Interquartile 25% (IQ1) | 5.4% | 2.0% |
| Interquartile 75% (IQ3) | 13.4% | 3.3% |
| Interquartile Range (IQR) | 8.0% | 1.3% |
| Standard Deviation (Sample) | 14.5% | 1.6% |
| Standard Deviation (Population) | 14.4% | 1.6% |
Similar Demographics by Hearing Disability
Demographics Similar to Scottish by Hearing Disability
In terms of hearing disability, the demographic groups most similar to Scottish are Pennsylvania German (3.7%, a difference of 0.030%), German (3.7%, a difference of 0.060%), Dutch (3.7%, a difference of 0.13%), Menominee (3.7%, a difference of 0.19%), and Celtic (3.7%, a difference of 0.34%).
| Demographics | Rating | Rank | Hearing Disability |
| Norwegians | 0.0 /100 | #293 | Tragic 3.7% |
| Iroquois | 0.0 /100 | #294 | Tragic 3.7% |
| Welsh | 0.0 /100 | #295 | Tragic 3.7% |
| Pima | 0.0 /100 | #296 | Tragic 3.7% |
| Immigrants | Azores | 0.0 /100 | #297 | Tragic 3.7% |
| Celtics | 0.0 /100 | #298 | Tragic 3.7% |
| Germans | 0.0 /100 | #299 | Tragic 3.7% |
| Scottish | 0.0 /100 | #300 | Tragic 3.7% |
| Pennsylvania Germans | 0.0 /100 | #301 | Tragic 3.7% |
| Dutch | 0.0 /100 | #302 | Tragic 3.7% |
| Menominee | 0.0 /100 | #303 | Tragic 3.7% |
| French | 0.0 /100 | #304 | Tragic 3.8% |
| English | 0.0 /100 | #305 | Tragic 3.8% |
| Marshallese | 0.0 /100 | #306 | Tragic 3.8% |
| French Canadians | 0.0 /100 | #307 | Tragic 3.8% |
Demographics Similar to Argentineans by Hearing Disability
In terms of hearing disability, the demographic groups most similar to Argentineans are Immigrants from Korea (2.7%, a difference of 0.0%), Immigrants from Saudi Arabia (2.7%, a difference of 0.030%), Asian (2.7%, a difference of 0.030%), Immigrants from Malaysia (2.7%, a difference of 0.060%), and Afghan (2.7%, a difference of 0.080%).
| Demographics | Rating | Rank | Hearing Disability |
| Immigrants | Belize | 98.2 /100 | #66 | Exceptional 2.7% |
| Egyptians | 98.1 /100 | #67 | Exceptional 2.7% |
| Immigrants | Africa | 98.0 /100 | #68 | Exceptional 2.7% |
| Nicaraguans | 97.9 /100 | #69 | Exceptional 2.7% |
| Peruvians | 97.7 /100 | #70 | Exceptional 2.7% |
| Central Americans | 97.7 /100 | #71 | Exceptional 2.7% |
| Afghans | 97.6 /100 | #72 | Exceptional 2.7% |
| Argentineans | 97.5 /100 | #73 | Exceptional 2.7% |
| Immigrants | Korea | 97.5 /100 | #74 | Exceptional 2.7% |
| Immigrants | Saudi Arabia | 97.5 /100 | #75 | Exceptional 2.7% |
| Asians | 97.5 /100 | #76 | Exceptional 2.7% |
| Immigrants | Malaysia | 97.5 /100 | #77 | Exceptional 2.7% |
| Mongolians | 97.4 /100 | #78 | Exceptional 2.7% |
| Colombians | 97.4 /100 | #79 | Exceptional 2.7% |
| Immigrants | Asia | 97.2 /100 | #80 | Exceptional 2.7% |