Scotch-Irish vs Immigrants from Latvia 10th Grade
COMPARE
Scotch-Irish
Immigrants from Latvia
10th Grade
10th Grade Comparison
Scotch-Irish
Immigrants from Latvia
95.2%
10TH GRADE
99.9/ 100
METRIC RATING
40th/ 347
METRIC RANK
94.7%
10TH GRADE
99.2/ 100
METRIC RATING
81st/ 347
METRIC RANK
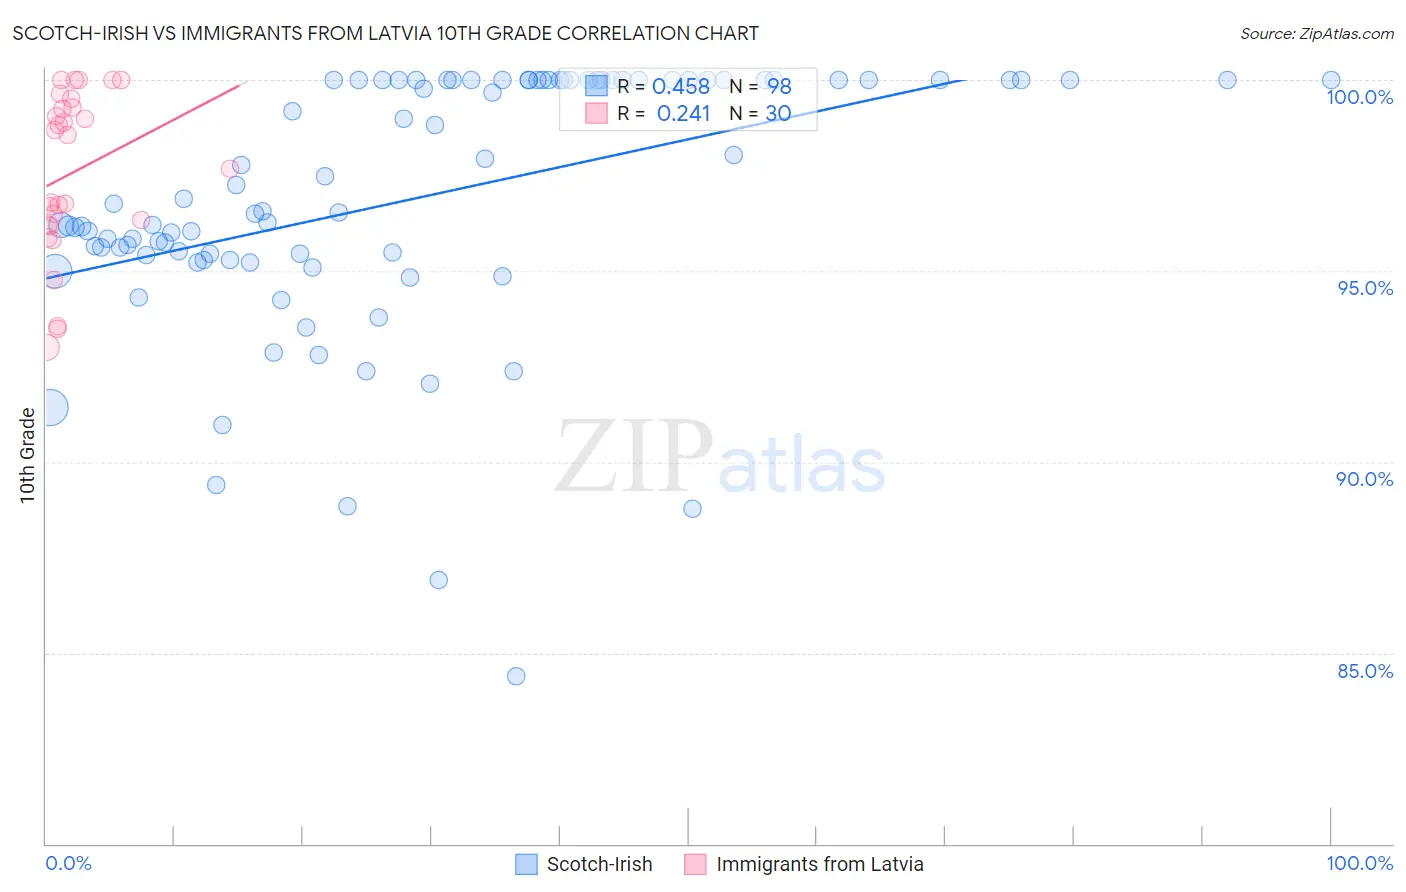
Scotch-Irish vs Immigrants from Latvia 10th Grade Correlation Chart
The statistical analysis conducted on geographies consisting of 548,777,546 people shows a moderate positive correlation between the proportion of Scotch-Irish and percentage of population with at least 10th grade education in the United States with a correlation coefficient (R) of 0.458 and weighted average of 95.2%. Similarly, the statistical analysis conducted on geographies consisting of 113,734,781 people shows a weak positive correlation between the proportion of Immigrants from Latvia and percentage of population with at least 10th grade education in the United States with a correlation coefficient (R) of 0.241 and weighted average of 94.7%, a difference of 0.52%.
10th Grade Correlation Summary
| Measurement | Scotch-Irish | Immigrants from Latvia |
| Minimum | 84.4% | 93.0% |
| Maximum | 100.0% | 100.0% |
| Range | 15.6% | 7.0% |
| Mean | 96.9% | 97.6% |
| Median | 96.7% | 98.1% |
| Interquartile 25% (IQ1) | 95.4% | 96.2% |
| Interquartile 75% (IQ3) | 100.0% | 99.3% |
| Interquartile Range (IQR) | 4.6% | 3.1% |
| Standard Deviation (Sample) | 3.3% | 2.1% |
| Standard Deviation (Population) | 3.3% | 2.1% |
Similar Demographics by 10th Grade
Demographics Similar to Scotch-Irish by 10th Grade
In terms of 10th grade, the demographic groups most similar to Scotch-Irish are Immigrants from Scotland (95.2%, a difference of 0.0%), Russian (95.2%, a difference of 0.020%), Northern European (95.3%, a difference of 0.030%), French Canadian (95.3%, a difference of 0.060%), and Slavic (95.2%, a difference of 0.060%).
| Demographics | Rating | Rank | 10th Grade |
| French | 100.0 /100 | #33 | Exceptional 95.3% |
| British | 99.9 /100 | #34 | Exceptional 95.3% |
| Estonians | 99.9 /100 | #35 | Exceptional 95.3% |
| Immigrants | India | 99.9 /100 | #36 | Exceptional 95.3% |
| French Canadians | 99.9 /100 | #37 | Exceptional 95.3% |
| Northern Europeans | 99.9 /100 | #38 | Exceptional 95.3% |
| Immigrants | Scotland | 99.9 /100 | #39 | Exceptional 95.2% |
| Scotch-Irish | 99.9 /100 | #40 | Exceptional 95.2% |
| Russians | 99.9 /100 | #41 | Exceptional 95.2% |
| Slavs | 99.9 /100 | #42 | Exceptional 95.2% |
| Macedonians | 99.9 /100 | #43 | Exceptional 95.2% |
| Immigrants | Northern Europe | 99.9 /100 | #44 | Exceptional 95.2% |
| Greeks | 99.9 /100 | #45 | Exceptional 95.2% |
| Czechoslovakians | 99.9 /100 | #46 | Exceptional 95.1% |
| Serbians | 99.9 /100 | #47 | Exceptional 95.1% |
Demographics Similar to Immigrants from Latvia by 10th Grade
In terms of 10th grade, the demographic groups most similar to Immigrants from Latvia are Immigrants from Denmark (94.7%, a difference of 0.0%), Immigrants from Czechoslovakia (94.7%, a difference of 0.010%), Swiss (94.7%, a difference of 0.030%), Immigrants from Western Europe (94.7%, a difference of 0.030%), and Filipino (94.8%, a difference of 0.040%).
| Demographics | Rating | Rank | 10th Grade |
| Canadians | 99.6 /100 | #74 | Exceptional 94.9% |
| Okinawans | 99.5 /100 | #75 | Exceptional 94.8% |
| Romanians | 99.5 /100 | #76 | Exceptional 94.8% |
| Immigrants | South Africa | 99.5 /100 | #77 | Exceptional 94.8% |
| Filipinos | 99.3 /100 | #78 | Exceptional 94.8% |
| Immigrants | Czechoslovakia | 99.2 /100 | #79 | Exceptional 94.7% |
| Immigrants | Denmark | 99.2 /100 | #80 | Exceptional 94.7% |
| Immigrants | Latvia | 99.2 /100 | #81 | Exceptional 94.7% |
| Swiss | 99.1 /100 | #82 | Exceptional 94.7% |
| Immigrants | Western Europe | 99.1 /100 | #83 | Exceptional 94.7% |
| Icelanders | 99.1 /100 | #84 | Exceptional 94.7% |
| Crow | 99.0 /100 | #85 | Exceptional 94.7% |
| Puget Sound Salish | 99.0 /100 | #86 | Exceptional 94.7% |
| Immigrants | Saudi Arabia | 99.0 /100 | #87 | Exceptional 94.7% |
| Immigrants | Japan | 99.0 /100 | #88 | Exceptional 94.7% |