Immigrants from Switzerland vs Immigrants from Guyana Male Disability
COMPARE
Immigrants from Switzerland
Immigrants from Guyana
Male Disability
Male Disability Comparison
Immigrants from Switzerland
Immigrants from Guyana
10.7%
MALE DISABILITY
96.1/ 100
METRIC RATING
99th/ 347
METRIC RANK
10.6%
MALE DISABILITY
98.2/ 100
METRIC RATING
82nd/ 347
METRIC RANK
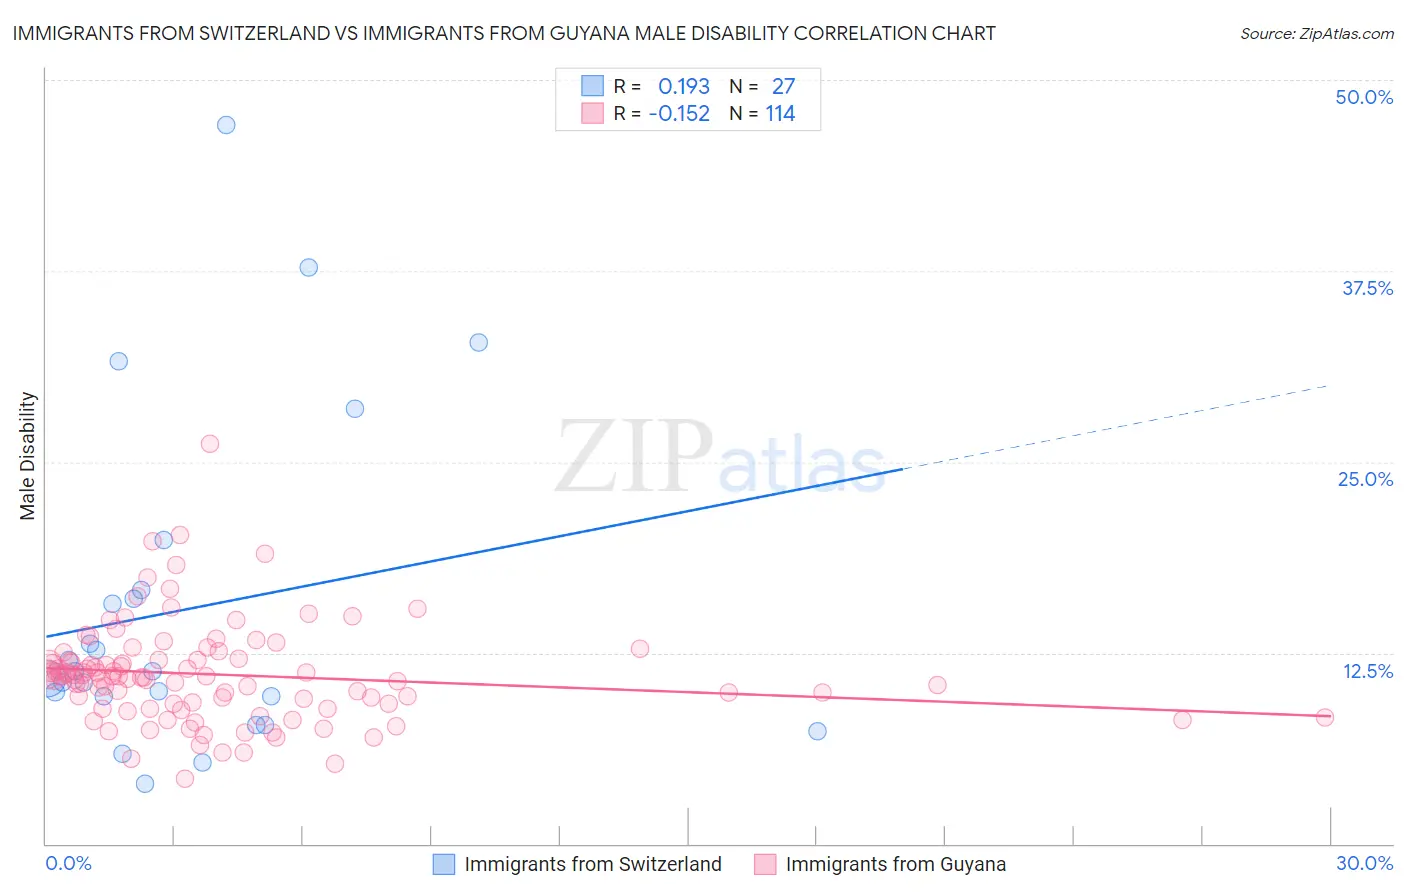
Immigrants from Switzerland vs Immigrants from Guyana Male Disability Correlation Chart
The statistical analysis conducted on geographies consisting of 148,082,366 people shows a poor positive correlation between the proportion of Immigrants from Switzerland and percentage of males with a disability in the United States with a correlation coefficient (R) of 0.193 and weighted average of 10.7%. Similarly, the statistical analysis conducted on geographies consisting of 183,704,199 people shows a poor negative correlation between the proportion of Immigrants from Guyana and percentage of males with a disability in the United States with a correlation coefficient (R) of -0.152 and weighted average of 10.6%, a difference of 1.2%.
Male Disability Correlation Summary
| Measurement | Immigrants from Switzerland | Immigrants from Guyana |
| Minimum | 4.0% | 4.3% |
| Maximum | 47.1% | 26.1% |
| Range | 43.1% | 21.9% |
| Mean | 15.4% | 11.1% |
| Median | 11.3% | 10.9% |
| Interquartile 25% (IQ1) | 9.6% | 9.1% |
| Interquartile 75% (IQ3) | 16.6% | 12.1% |
| Interquartile Range (IQR) | 7.0% | 2.9% |
| Standard Deviation (Sample) | 10.8% | 3.3% |
| Standard Deviation (Population) | 10.6% | 3.3% |
Demographics Similar to Immigrants from Switzerland and Immigrants from Guyana by Male Disability
In terms of male disability, the demographic groups most similar to Immigrants from Switzerland are Immigrants from Kazakhstan (10.7%, a difference of 0.070%), Immigrants from Romania (10.7%, a difference of 0.14%), Immigrants from Armenia (10.7%, a difference of 0.20%), Nicaraguan (10.7%, a difference of 0.22%), and Chilean (10.7%, a difference of 0.32%). Similarly, the demographic groups most similar to Immigrants from Guyana are Immigrants from Poland (10.6%, a difference of 0.060%), Immigrants from Chile (10.6%, a difference of 0.070%), Bulgarian (10.6%, a difference of 0.080%), Immigrants from Jordan (10.6%, a difference of 0.13%), and Sri Lankan (10.6%, a difference of 0.25%).
| Demographics | Rating | Rank | Male Disability |
| Immigrants | Jordan | 98.4 /100 | #80 | Exceptional 10.6% |
| Immigrants | Chile | 98.3 /100 | #81 | Exceptional 10.6% |
| Immigrants | Guyana | 98.2 /100 | #82 | Exceptional 10.6% |
| Immigrants | Poland | 98.1 /100 | #83 | Exceptional 10.6% |
| Bulgarians | 98.1 /100 | #84 | Exceptional 10.6% |
| Sri Lankans | 97.9 /100 | #85 | Exceptional 10.6% |
| Immigrants | Ireland | 97.9 /100 | #86 | Exceptional 10.6% |
| Immigrants | Vietnam | 97.9 /100 | #87 | Exceptional 10.6% |
| Immigrants | Western Asia | 97.8 /100 | #88 | Exceptional 10.6% |
| Immigrants | Nicaragua | 97.8 /100 | #89 | Exceptional 10.6% |
| Immigrants | Morocco | 97.7 /100 | #90 | Exceptional 10.6% |
| Immigrants | France | 97.6 /100 | #91 | Exceptional 10.6% |
| Palestinians | 97.4 /100 | #92 | Exceptional 10.7% |
| Immigrants | St. Vincent and the Grenadines | 97.1 /100 | #93 | Exceptional 10.7% |
| Immigrants | Sweden | 96.9 /100 | #94 | Exceptional 10.7% |
| Chileans | 96.9 /100 | #95 | Exceptional 10.7% |
| Nicaraguans | 96.6 /100 | #96 | Exceptional 10.7% |
| Immigrants | Armenia | 96.6 /100 | #97 | Exceptional 10.7% |
| Immigrants | Romania | 96.5 /100 | #98 | Exceptional 10.7% |
| Immigrants | Switzerland | 96.1 /100 | #99 | Exceptional 10.7% |
| Immigrants | Kazakhstan | 95.9 /100 | #100 | Exceptional 10.7% |