Iraqi vs Immigrants from Dominica Female Disability
COMPARE
Iraqi
Immigrants from Dominica
Female Disability
Female Disability Comparison
Iraqis
Immigrants from Dominica
12.3%
FEMALE DISABILITY
36.0/ 100
METRIC RATING
184th/ 347
METRIC RANK
13.0%
FEMALE DISABILITY
0.1/ 100
METRIC RATING
276th/ 347
METRIC RANK
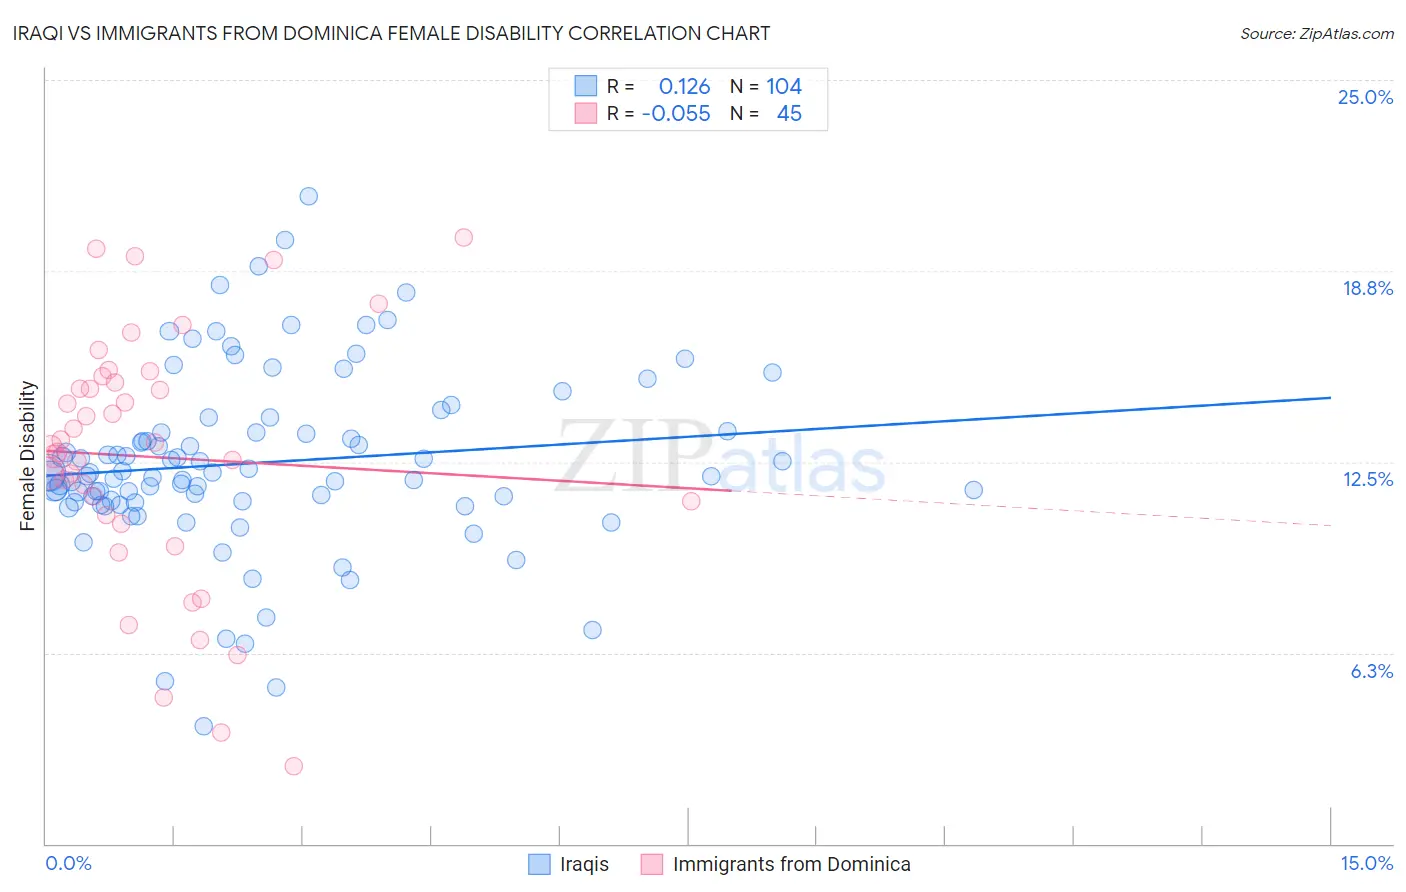
Iraqi vs Immigrants from Dominica Female Disability Correlation Chart
The statistical analysis conducted on geographies consisting of 170,640,782 people shows a poor positive correlation between the proportion of Iraqis and percentage of females with a disability in the United States with a correlation coefficient (R) of 0.126 and weighted average of 12.3%. Similarly, the statistical analysis conducted on geographies consisting of 83,793,109 people shows a slight negative correlation between the proportion of Immigrants from Dominica and percentage of females with a disability in the United States with a correlation coefficient (R) of -0.055 and weighted average of 13.0%, a difference of 5.8%.
Female Disability Correlation Summary
| Measurement | Iraqi | Immigrants from Dominica |
| Minimum | 3.8% | 2.5% |
| Maximum | 21.2% | 19.9% |
| Range | 17.3% | 17.3% |
| Mean | 12.5% | 12.7% |
| Median | 12.1% | 13.0% |
| Interquartile 25% (IQ1) | 11.2% | 10.6% |
| Interquartile 75% (IQ3) | 13.5% | 15.2% |
| Interquartile Range (IQR) | 2.3% | 4.5% |
| Standard Deviation (Sample) | 3.0% | 4.1% |
| Standard Deviation (Population) | 2.9% | 4.1% |
Similar Demographics by Female Disability
Demographics Similar to Iraqis by Female Disability
In terms of female disability, the demographic groups most similar to Iraqis are Cuban (12.3%, a difference of 0.020%), Norwegian (12.3%, a difference of 0.040%), Immigrants from Canada (12.3%, a difference of 0.050%), Albanian (12.3%, a difference of 0.080%), and Immigrants from Uzbekistan (12.3%, a difference of 0.080%).
| Demographics | Rating | Rank | Female Disability |
| Immigrants | Ghana | 42.5 /100 | #177 | Average 12.2% |
| Immigrants | Western Europe | 40.9 /100 | #178 | Average 12.2% |
| Immigrants | Fiji | 38.2 /100 | #179 | Fair 12.3% |
| Albanians | 37.9 /100 | #180 | Fair 12.3% |
| Immigrants | Canada | 37.2 /100 | #181 | Fair 12.3% |
| Norwegians | 36.9 /100 | #182 | Fair 12.3% |
| Cubans | 36.5 /100 | #183 | Fair 12.3% |
| Iraqis | 36.0 /100 | #184 | Fair 12.3% |
| Immigrants | Uzbekistan | 33.9 /100 | #185 | Fair 12.3% |
| Austrians | 33.3 /100 | #186 | Fair 12.3% |
| Serbians | 33.1 /100 | #187 | Fair 12.3% |
| Immigrants | North America | 32.8 /100 | #188 | Fair 12.3% |
| Immigrants | Albania | 31.6 /100 | #189 | Fair 12.3% |
| Immigrants | Honduras | 31.3 /100 | #190 | Fair 12.3% |
| Armenians | 29.7 /100 | #191 | Fair 12.3% |
Demographics Similar to Immigrants from Dominica by Female Disability
In terms of female disability, the demographic groups most similar to Immigrants from Dominica are Cheyenne (13.0%, a difference of 0.050%), Portuguese (13.0%, a difference of 0.10%), Spanish (13.0%, a difference of 0.20%), Sioux (12.9%, a difference of 0.22%), and German (12.9%, a difference of 0.24%).
| Demographics | Rating | Rank | Female Disability |
| Indonesians | 0.4 /100 | #269 | Tragic 12.8% |
| Immigrants | Liberia | 0.3 /100 | #270 | Tragic 12.9% |
| Dutch | 0.2 /100 | #271 | Tragic 12.9% |
| Germans | 0.1 /100 | #272 | Tragic 12.9% |
| Sioux | 0.1 /100 | #273 | Tragic 12.9% |
| Portuguese | 0.1 /100 | #274 | Tragic 13.0% |
| Cheyenne | 0.1 /100 | #275 | Tragic 13.0% |
| Immigrants | Dominica | 0.1 /100 | #276 | Tragic 13.0% |
| Spanish | 0.1 /100 | #277 | Tragic 13.0% |
| Scottish | 0.1 /100 | #278 | Tragic 13.0% |
| Arapaho | 0.1 /100 | #279 | Tragic 13.0% |
| Irish | 0.1 /100 | #280 | Tragic 13.1% |
| U.S. Virgin Islanders | 0.1 /100 | #281 | Tragic 13.1% |
| Welsh | 0.0 /100 | #282 | Tragic 13.1% |
| English | 0.0 /100 | #283 | Tragic 13.1% |