Immigrants from Guatemala vs French American Indian Ambulatory Disability
COMPARE
Immigrants from Guatemala
French American Indian
Ambulatory Disability
Ambulatory Disability Comparison
Immigrants from Guatemala
French American Indians
6.2%
AMBULATORY DISABILITY
31.9/ 100
METRIC RATING
191st/ 347
METRIC RANK
6.9%
AMBULATORY DISABILITY
0.0/ 100
METRIC RATING
297th/ 347
METRIC RANK
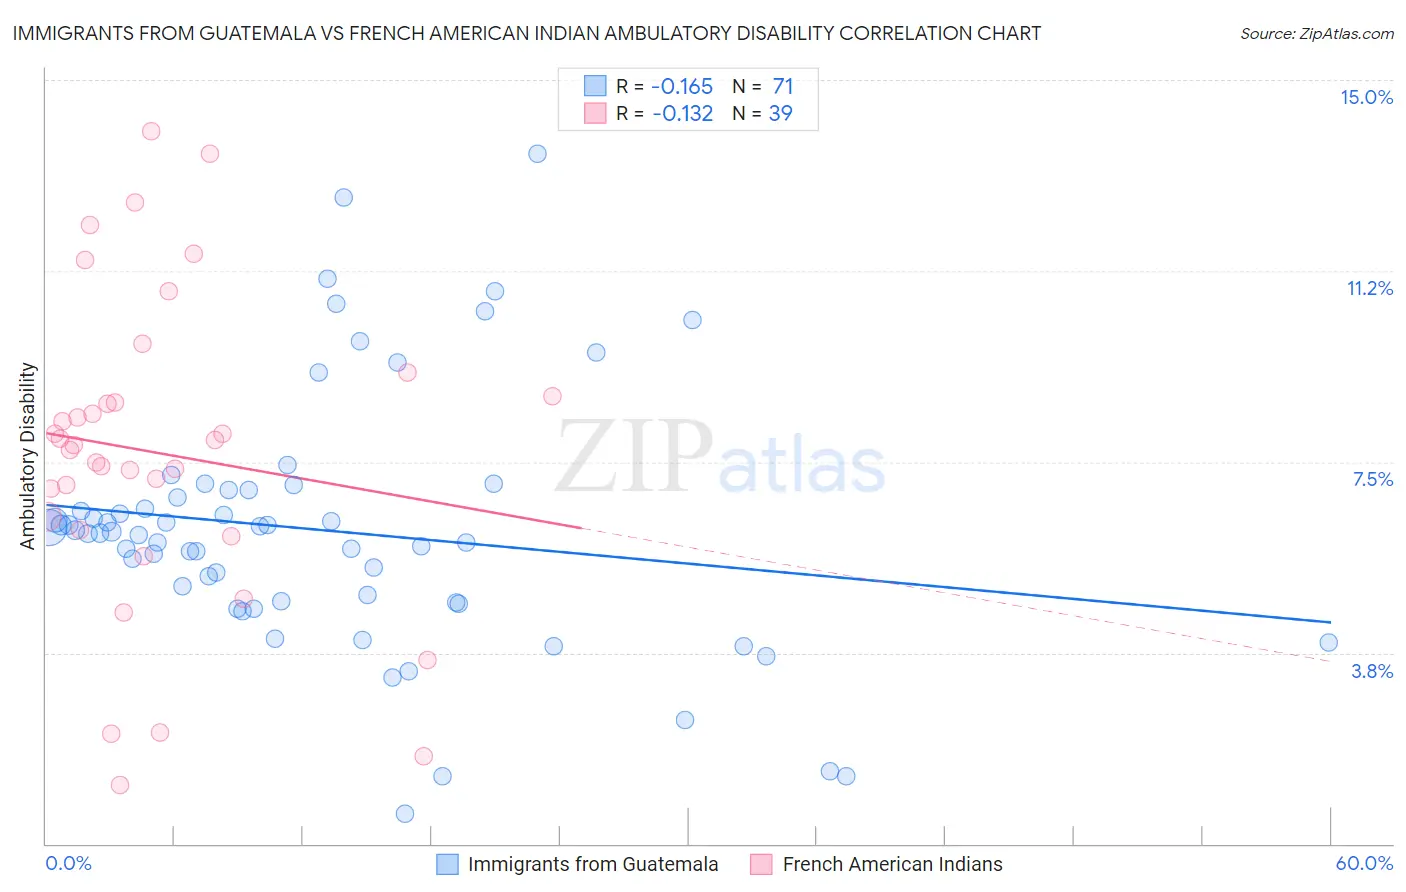
Immigrants from Guatemala vs French American Indian Ambulatory Disability Correlation Chart
The statistical analysis conducted on geographies consisting of 377,192,086 people shows a poor negative correlation between the proportion of Immigrants from Guatemala and percentage of population with ambulatory disability in the United States with a correlation coefficient (R) of -0.165 and weighted average of 6.2%. Similarly, the statistical analysis conducted on geographies consisting of 131,970,739 people shows a poor negative correlation between the proportion of French American Indians and percentage of population with ambulatory disability in the United States with a correlation coefficient (R) of -0.132 and weighted average of 6.9%, a difference of 12.2%.
Ambulatory Disability Correlation Summary
| Measurement | Immigrants from Guatemala | French American Indian |
| Minimum | 0.59% | 1.2% |
| Maximum | 13.5% | 14.0% |
| Range | 13.0% | 12.8% |
| Mean | 6.2% | 7.7% |
| Median | 6.1% | 7.8% |
| Interquartile 25% (IQ1) | 4.7% | 6.2% |
| Interquartile 75% (IQ3) | 7.0% | 8.8% |
| Interquartile Range (IQR) | 2.2% | 2.6% |
| Standard Deviation (Sample) | 2.5% | 3.1% |
| Standard Deviation (Population) | 2.5% | 3.0% |
Similar Demographics by Ambulatory Disability
Demographics Similar to Immigrants from Guatemala by Ambulatory Disability
In terms of ambulatory disability, the demographic groups most similar to Immigrants from Guatemala are Immigrants from Western Europe (6.2%, a difference of 0.020%), Immigrants from Western Africa (6.2%, a difference of 0.090%), Ukrainian (6.2%, a difference of 0.12%), Guatemalan (6.2%, a difference of 0.12%), and Alaska Native (6.2%, a difference of 0.13%).
| Demographics | Rating | Rank | Ambulatory Disability |
| Immigrants | Ghana | 41.2 /100 | #184 | Average 6.1% |
| Immigrants | Bosnia and Herzegovina | 37.2 /100 | #185 | Fair 6.2% |
| Europeans | 36.2 /100 | #186 | Fair 6.2% |
| Carpatho Rusyns | 35.3 /100 | #187 | Fair 6.2% |
| British | 34.3 /100 | #188 | Fair 6.2% |
| Ukrainians | 34.0 /100 | #189 | Fair 6.2% |
| Immigrants | Western Africa | 33.4 /100 | #190 | Fair 6.2% |
| Immigrants | Guatemala | 31.9 /100 | #191 | Fair 6.2% |
| Immigrants | Western Europe | 31.6 /100 | #192 | Fair 6.2% |
| Guatemalans | 30.0 /100 | #193 | Fair 6.2% |
| Alaska Natives | 29.8 /100 | #194 | Fair 6.2% |
| Belgians | 28.6 /100 | #195 | Fair 6.2% |
| Malaysians | 28.2 /100 | #196 | Fair 6.2% |
| Poles | 26.3 /100 | #197 | Fair 6.2% |
| Immigrants | Bangladesh | 24.6 /100 | #198 | Fair 6.2% |
Demographics Similar to French American Indians by Ambulatory Disability
In terms of ambulatory disability, the demographic groups most similar to French American Indians are Immigrants from Grenada (6.9%, a difference of 0.010%), Puget Sound Salish (6.9%, a difference of 0.14%), Marshallese (6.9%, a difference of 0.15%), Alaskan Athabascan (6.9%, a difference of 0.17%), and British West Indian (7.0%, a difference of 0.38%).
| Demographics | Rating | Rank | Ambulatory Disability |
| Scotch-Irish | 0.0 /100 | #290 | Tragic 6.9% |
| West Indians | 0.0 /100 | #291 | Tragic 6.9% |
| Cheyenne | 0.0 /100 | #292 | Tragic 6.9% |
| Immigrants | St. Vincent and the Grenadines | 0.0 /100 | #293 | Tragic 6.9% |
| Cape Verdeans | 0.0 /100 | #294 | Tragic 6.9% |
| Crow | 0.0 /100 | #295 | Tragic 6.9% |
| Alaskan Athabascans | 0.0 /100 | #296 | Tragic 6.9% |
| French American Indians | 0.0 /100 | #297 | Tragic 6.9% |
| Immigrants | Grenada | 0.0 /100 | #298 | Tragic 6.9% |
| Puget Sound Salish | 0.0 /100 | #299 | Tragic 6.9% |
| Marshallese | 0.0 /100 | #300 | Tragic 6.9% |
| British West Indians | 0.0 /100 | #301 | Tragic 7.0% |
| Immigrants | Armenia | 0.0 /100 | #302 | Tragic 7.0% |
| Africans | 0.0 /100 | #303 | Tragic 7.0% |
| Immigrants | Cabo Verde | 0.0 /100 | #304 | Tragic 7.0% |