Immigrants from Liberia vs Cuban Female Disability
COMPARE
Immigrants from Liberia
Cuban
Female Disability
Female Disability Comparison
Immigrants from Liberia
Cubans
12.9%
FEMALE DISABILITY
0.3/ 100
METRIC RATING
270th/ 347
METRIC RANK
12.3%
FEMALE DISABILITY
36.5/ 100
METRIC RATING
183rd/ 347
METRIC RANK
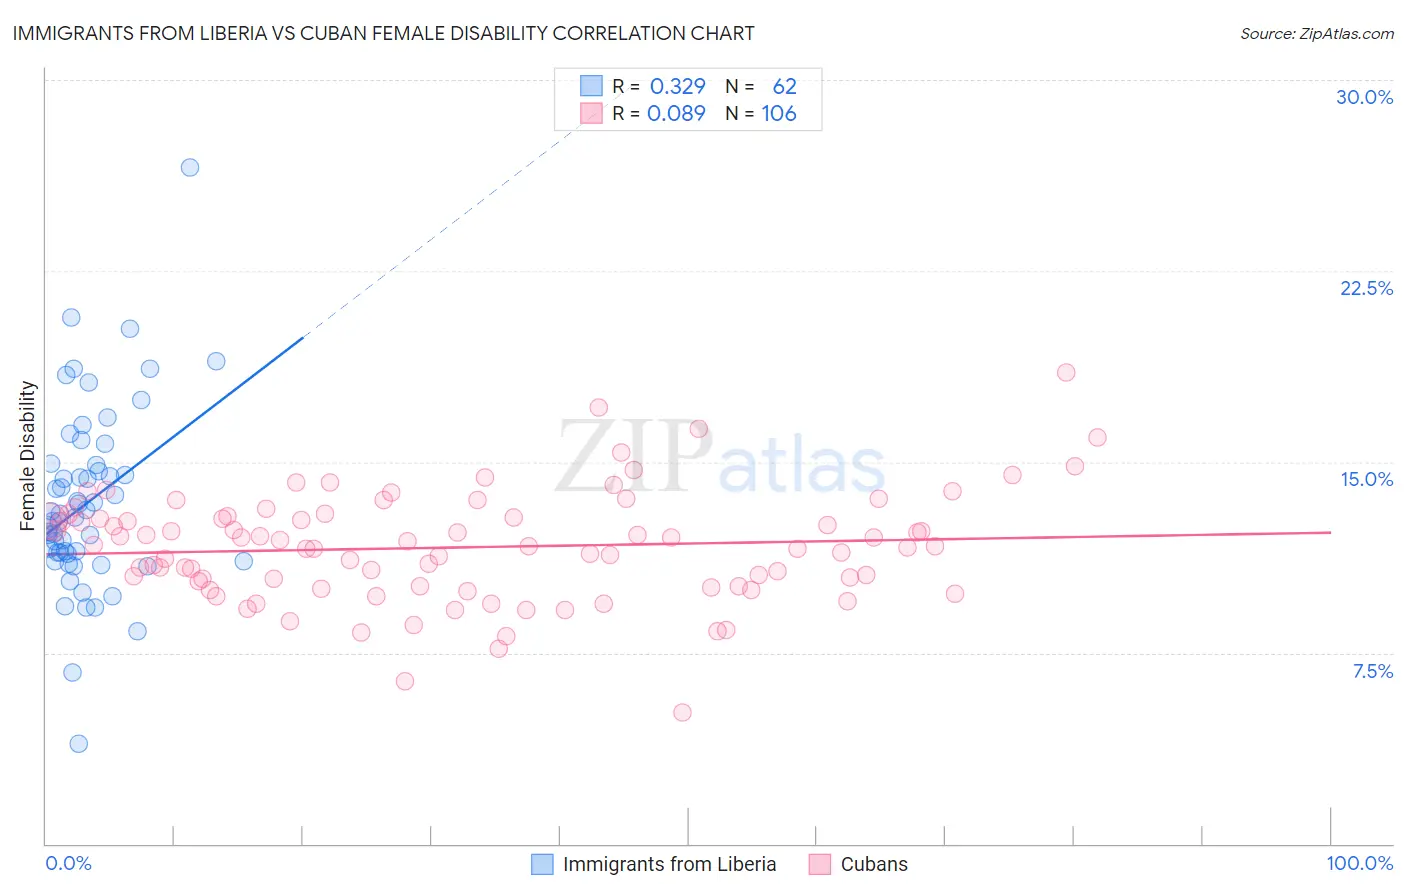
Immigrants from Liberia vs Cuban Female Disability Correlation Chart
The statistical analysis conducted on geographies consisting of 135,259,122 people shows a mild positive correlation between the proportion of Immigrants from Liberia and percentage of females with a disability in the United States with a correlation coefficient (R) of 0.329 and weighted average of 12.9%. Similarly, the statistical analysis conducted on geographies consisting of 449,245,212 people shows a slight positive correlation between the proportion of Cubans and percentage of females with a disability in the United States with a correlation coefficient (R) of 0.089 and weighted average of 12.3%, a difference of 4.9%.
Female Disability Correlation Summary
| Measurement | Immigrants from Liberia | Cuban |
| Minimum | 3.9% | 5.2% |
| Maximum | 26.5% | 18.5% |
| Range | 22.6% | 13.3% |
| Mean | 13.4% | 11.6% |
| Median | 12.9% | 11.7% |
| Interquartile 25% (IQ1) | 11.4% | 10.1% |
| Interquartile 75% (IQ3) | 14.9% | 12.8% |
| Interquartile Range (IQR) | 3.5% | 2.7% |
| Standard Deviation (Sample) | 3.6% | 2.1% |
| Standard Deviation (Population) | 3.6% | 2.1% |
Similar Demographics by Female Disability
Demographics Similar to Immigrants from Liberia by Female Disability
In terms of female disability, the demographic groups most similar to Immigrants from Liberia are Indonesian (12.8%, a difference of 0.18%), Immigrants from Laos (12.8%, a difference of 0.24%), Senegalese (12.8%, a difference of 0.27%), Finnish (12.8%, a difference of 0.28%), and West Indian (12.8%, a difference of 0.40%).
| Demographics | Rating | Rank | Female Disability |
| Spaniards | 0.7 /100 | #263 | Tragic 12.8% |
| Alaska Natives | 0.6 /100 | #264 | Tragic 12.8% |
| West Indians | 0.5 /100 | #265 | Tragic 12.8% |
| Finns | 0.4 /100 | #266 | Tragic 12.8% |
| Senegalese | 0.4 /100 | #267 | Tragic 12.8% |
| Immigrants | Laos | 0.4 /100 | #268 | Tragic 12.8% |
| Indonesians | 0.4 /100 | #269 | Tragic 12.8% |
| Immigrants | Liberia | 0.3 /100 | #270 | Tragic 12.9% |
| Dutch | 0.2 /100 | #271 | Tragic 12.9% |
| Germans | 0.1 /100 | #272 | Tragic 12.9% |
| Sioux | 0.1 /100 | #273 | Tragic 12.9% |
| Portuguese | 0.1 /100 | #274 | Tragic 13.0% |
| Cheyenne | 0.1 /100 | #275 | Tragic 13.0% |
| Immigrants | Dominica | 0.1 /100 | #276 | Tragic 13.0% |
| Spanish | 0.1 /100 | #277 | Tragic 13.0% |
Demographics Similar to Cubans by Female Disability
In terms of female disability, the demographic groups most similar to Cubans are Norwegian (12.3%, a difference of 0.020%), Iraqi (12.3%, a difference of 0.020%), Immigrants from Canada (12.3%, a difference of 0.030%), Albanian (12.3%, a difference of 0.060%), and Immigrants from Fiji (12.3%, a difference of 0.070%).
| Demographics | Rating | Rank | Female Disability |
| Immigrants | Guyana | 43.1 /100 | #176 | Average 12.2% |
| Immigrants | Ghana | 42.5 /100 | #177 | Average 12.2% |
| Immigrants | Western Europe | 40.9 /100 | #178 | Average 12.2% |
| Immigrants | Fiji | 38.2 /100 | #179 | Fair 12.3% |
| Albanians | 37.9 /100 | #180 | Fair 12.3% |
| Immigrants | Canada | 37.2 /100 | #181 | Fair 12.3% |
| Norwegians | 36.9 /100 | #182 | Fair 12.3% |
| Cubans | 36.5 /100 | #183 | Fair 12.3% |
| Iraqis | 36.0 /100 | #184 | Fair 12.3% |
| Immigrants | Uzbekistan | 33.9 /100 | #185 | Fair 12.3% |
| Austrians | 33.3 /100 | #186 | Fair 12.3% |
| Serbians | 33.1 /100 | #187 | Fair 12.3% |
| Immigrants | North America | 32.8 /100 | #188 | Fair 12.3% |
| Immigrants | Albania | 31.6 /100 | #189 | Fair 12.3% |
| Immigrants | Honduras | 31.3 /100 | #190 | Fair 12.3% |