West Indian vs Immigrants from Denmark Disability Age 65 to 74
COMPARE
West Indian
Immigrants from Denmark
Disability Age 65 to 74
Disability Age 65 to 74 Comparison
West Indians
Immigrants from Denmark
24.5%
DISABILITY AGE 65 TO 74
3.4/ 100
METRIC RATING
237th/ 347
METRIC RANK
21.5%
DISABILITY AGE 65 TO 74
99.5/ 100
METRIC RATING
56th/ 347
METRIC RANK
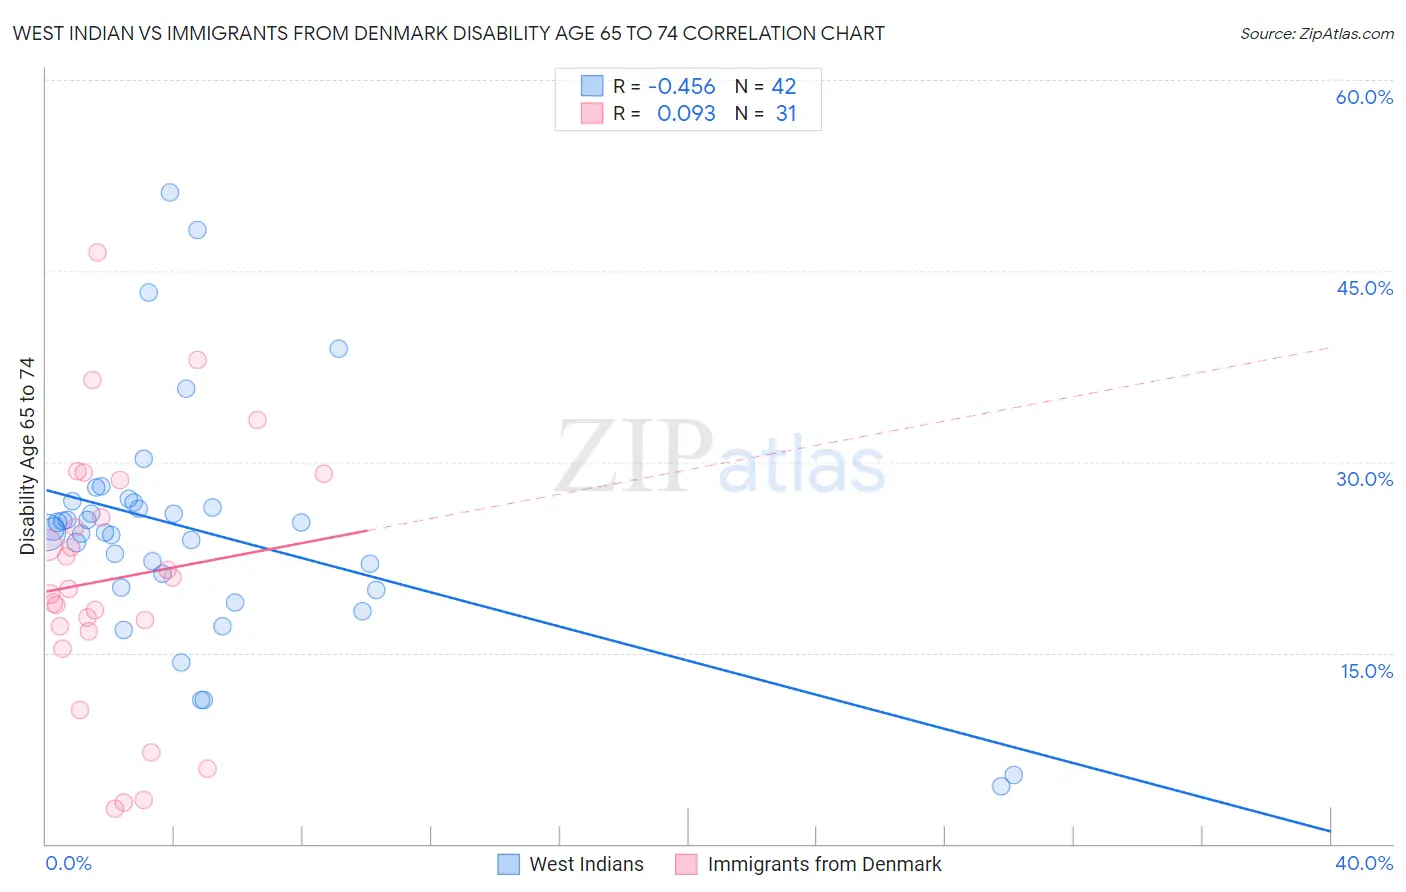
West Indian vs Immigrants from Denmark Disability Age 65 to 74 Correlation Chart
The statistical analysis conducted on geographies consisting of 253,647,264 people shows a moderate negative correlation between the proportion of West Indians and percentage of population with a disability between the ages 65 and 75 in the United States with a correlation coefficient (R) of -0.456 and weighted average of 24.5%. Similarly, the statistical analysis conducted on geographies consisting of 136,388,278 people shows a slight positive correlation between the proportion of Immigrants from Denmark and percentage of population with a disability between the ages 65 and 75 in the United States with a correlation coefficient (R) of 0.093 and weighted average of 21.5%, a difference of 13.8%.
Disability Age 65 to 74 Correlation Summary
| Measurement | West Indian | Immigrants from Denmark |
| Minimum | 4.5% | 2.7% |
| Maximum | 51.2% | 46.4% |
| Range | 46.7% | 43.7% |
| Mean | 24.6% | 20.8% |
| Median | 24.6% | 20.0% |
| Interquartile 25% (IQ1) | 20.1% | 16.7% |
| Interquartile 75% (IQ3) | 26.8% | 28.6% |
| Interquartile Range (IQR) | 6.7% | 11.9% |
| Standard Deviation (Sample) | 9.3% | 10.4% |
| Standard Deviation (Population) | 9.1% | 10.2% |
Similar Demographics by Disability Age 65 to 74
Demographics Similar to West Indians by Disability Age 65 to 74
In terms of disability age 65 to 74, the demographic groups most similar to West Indians are German Russian (24.4%, a difference of 0.10%), Scotch-Irish (24.4%, a difference of 0.14%), Immigrants from Ghana (24.5%, a difference of 0.17%), Panamanian (24.4%, a difference of 0.29%), and Immigrants from Caribbean (24.6%, a difference of 0.39%).
| Demographics | Rating | Rank | Disability Age 65 to 74 |
| Barbadians | 6.0 /100 | #230 | Tragic 24.3% |
| Immigrants | Thailand | 5.2 /100 | #231 | Tragic 24.3% |
| Immigrants | Zaire | 5.0 /100 | #232 | Tragic 24.3% |
| Bahamians | 4.5 /100 | #233 | Tragic 24.4% |
| Panamanians | 4.2 /100 | #234 | Tragic 24.4% |
| Scotch-Irish | 3.8 /100 | #235 | Tragic 24.4% |
| German Russians | 3.7 /100 | #236 | Tragic 24.4% |
| West Indians | 3.4 /100 | #237 | Tragic 24.5% |
| Immigrants | Ghana | 3.0 /100 | #238 | Tragic 24.5% |
| Immigrants | Caribbean | 2.6 /100 | #239 | Tragic 24.6% |
| Spaniards | 2.4 /100 | #240 | Tragic 24.6% |
| Immigrants | Western Africa | 2.3 /100 | #241 | Tragic 24.6% |
| Immigrants | Senegal | 2.2 /100 | #242 | Tragic 24.6% |
| Spanish | 2.2 /100 | #243 | Tragic 24.6% |
| Armenians | 2.0 /100 | #244 | Tragic 24.7% |
Demographics Similar to Immigrants from Denmark by Disability Age 65 to 74
In terms of disability age 65 to 74, the demographic groups most similar to Immigrants from Denmark are Immigrants from Romania (21.5%, a difference of 0.020%), Immigrants from Italy (21.5%, a difference of 0.10%), Immigrants from Asia (21.5%, a difference of 0.10%), Immigrants from France (21.5%, a difference of 0.11%), and Bhutanese (21.5%, a difference of 0.11%).
| Demographics | Rating | Rank | Disability Age 65 to 74 |
| Luxembourgers | 99.7 /100 | #49 | Exceptional 21.4% |
| Immigrants | Malaysia | 99.7 /100 | #50 | Exceptional 21.4% |
| Immigrants | Serbia | 99.6 /100 | #51 | Exceptional 21.4% |
| Immigrants | France | 99.6 /100 | #52 | Exceptional 21.5% |
| Bhutanese | 99.6 /100 | #53 | Exceptional 21.5% |
| Immigrants | Italy | 99.6 /100 | #54 | Exceptional 21.5% |
| Immigrants | Romania | 99.5 /100 | #55 | Exceptional 21.5% |
| Immigrants | Denmark | 99.5 /100 | #56 | Exceptional 21.5% |
| Immigrants | Asia | 99.5 /100 | #57 | Exceptional 21.5% |
| Immigrants | Pakistan | 99.5 /100 | #58 | Exceptional 21.5% |
| Zimbabweans | 99.5 /100 | #59 | Exceptional 21.5% |
| Immigrants | North Macedonia | 99.5 /100 | #60 | Exceptional 21.6% |
| Egyptians | 99.5 /100 | #61 | Exceptional 21.6% |
| Carpatho Rusyns | 99.5 /100 | #62 | Exceptional 21.6% |
| Immigrants | Europe | 99.4 /100 | #63 | Exceptional 21.6% |