Russian vs Italian Cognitive Disability
COMPARE
Russian
Italian
Cognitive Disability
Cognitive Disability Comparison
Russians
Italians
16.4%
COGNITIVE DISABILITY
99.9/ 100
METRIC RATING
34th/ 347
METRIC RANK
16.4%
COGNITIVE DISABILITY
99.9/ 100
METRIC RATING
33rd/ 347
METRIC RANK
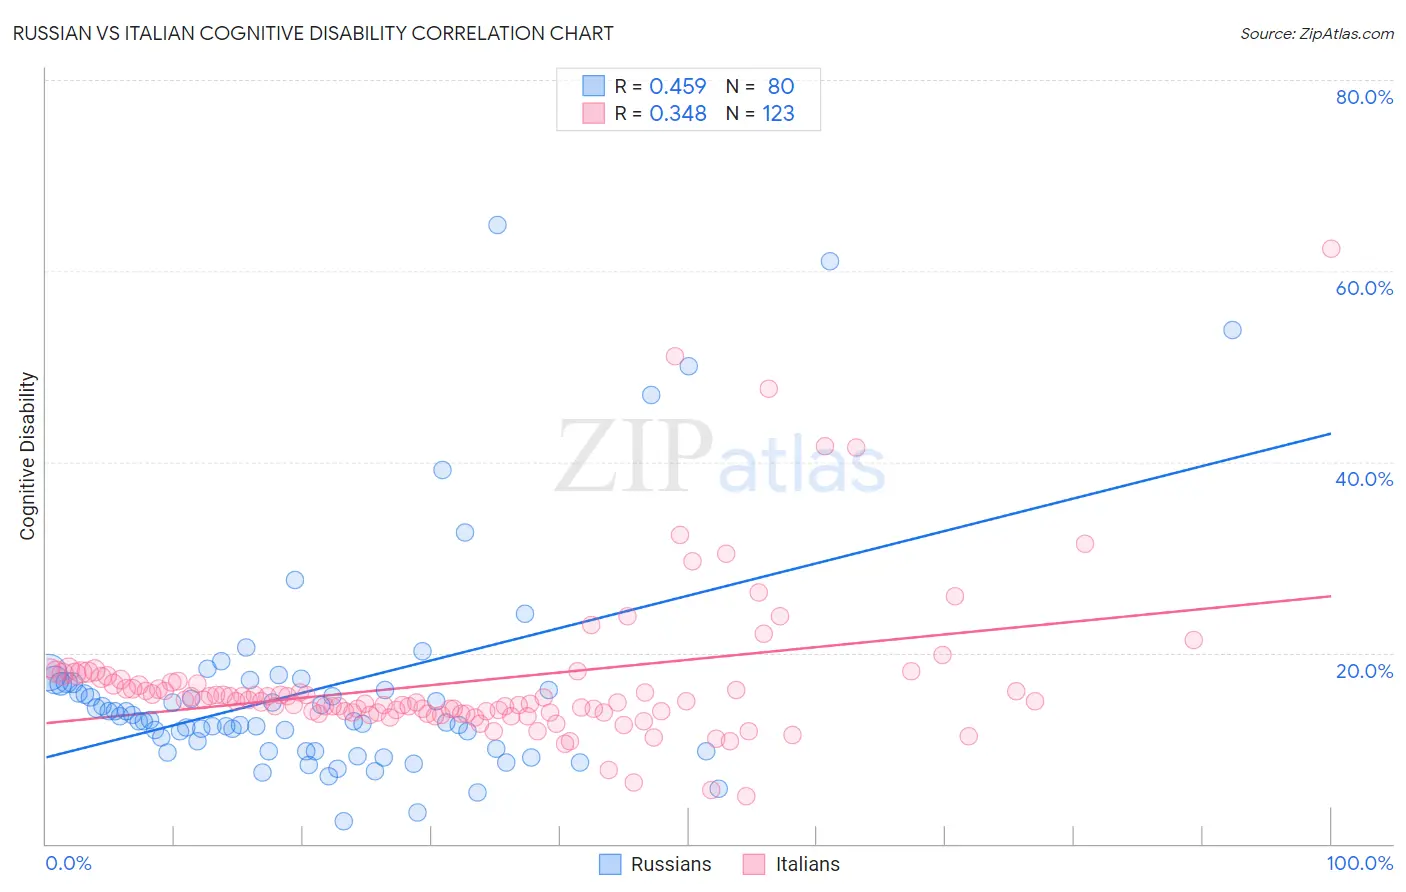
Russian vs Italian Cognitive Disability Correlation Chart
The statistical analysis conducted on geographies consisting of 512,152,080 people shows a moderate positive correlation between the proportion of Russians and percentage of population with cognitive disability in the United States with a correlation coefficient (R) of 0.459 and weighted average of 16.4%. Similarly, the statistical analysis conducted on geographies consisting of 574,911,788 people shows a mild positive correlation between the proportion of Italians and percentage of population with cognitive disability in the United States with a correlation coefficient (R) of 0.348 and weighted average of 16.4%, a difference of 0.0%.
Cognitive Disability Correlation Summary
| Measurement | Russian | Italian |
| Minimum | 2.3% | 4.9% |
| Maximum | 64.9% | 62.3% |
| Range | 62.5% | 57.4% |
| Mean | 16.1% | 16.9% |
| Median | 12.9% | 15.0% |
| Interquartile 25% (IQ1) | 9.9% | 13.7% |
| Interquartile 75% (IQ3) | 16.8% | 17.1% |
| Interquartile Range (IQR) | 7.0% | 3.3% |
| Standard Deviation (Sample) | 11.7% | 8.0% |
| Standard Deviation (Population) | 11.6% | 8.0% |
Demographics Similar to Russians and Italians by Cognitive Disability
In terms of cognitive disability, the demographic groups most similar to Russians are Immigrants from Israel (16.4%, a difference of 0.080%), Slovak (16.4%, a difference of 0.080%), Greek (16.4%, a difference of 0.090%), Immigrants from Romania (16.4%, a difference of 0.13%), and Filipino (16.4%, a difference of 0.15%). Similarly, the demographic groups most similar to Italians are Immigrants from Israel (16.4%, a difference of 0.070%), Slovak (16.4%, a difference of 0.080%), Greek (16.4%, a difference of 0.090%), Immigrants from Romania (16.4%, a difference of 0.13%), and Filipino (16.4%, a difference of 0.15%).
| Demographics | Rating | Rank | Cognitive Disability |
| Croatians | 99.9 /100 | #23 | Exceptional 16.4% |
| Immigrants | Argentina | 99.9 /100 | #24 | Exceptional 16.4% |
| Luxembourgers | 99.9 /100 | #25 | Exceptional 16.4% |
| Immigrants | Croatia | 99.9 /100 | #26 | Exceptional 16.4% |
| Immigrants | Pakistan | 99.9 /100 | #27 | Exceptional 16.4% |
| Poles | 99.9 /100 | #28 | Exceptional 16.4% |
| Filipinos | 99.9 /100 | #29 | Exceptional 16.4% |
| Czechs | 99.9 /100 | #30 | Exceptional 16.4% |
| Immigrants | Romania | 99.9 /100 | #31 | Exceptional 16.4% |
| Immigrants | Israel | 99.9 /100 | #32 | Exceptional 16.4% |
| Italians | 99.9 /100 | #33 | Exceptional 16.4% |
| Russians | 99.9 /100 | #34 | Exceptional 16.4% |
| Slovaks | 99.9 /100 | #35 | Exceptional 16.4% |
| Greeks | 99.9 /100 | #36 | Exceptional 16.4% |
| Slovenes | 99.9 /100 | #37 | Exceptional 16.5% |
| Immigrants | Eastern Europe | 99.9 /100 | #38 | Exceptional 16.5% |
| Bolivians | 99.9 /100 | #39 | Exceptional 16.5% |
| Immigrants | Belarus | 99.9 /100 | #40 | Exceptional 16.5% |
| Cubans | 99.9 /100 | #41 | Exceptional 16.5% |
| Hungarians | 99.9 /100 | #42 | Exceptional 16.5% |
| Immigrants | Canada | 99.8 /100 | #43 | Exceptional 16.5% |