Slovene vs Immigrants from Zaire Vision Disability
COMPARE
Slovene
Immigrants from Zaire
Vision Disability
Vision Disability Comparison
Slovenes
Immigrants from Zaire
2.1%
VISION DISABILITY
73.6/ 100
METRIC RATING
154th/ 347
METRIC RANK
2.2%
VISION DISABILITY
18.0/ 100
METRIC RATING
202nd/ 347
METRIC RANK
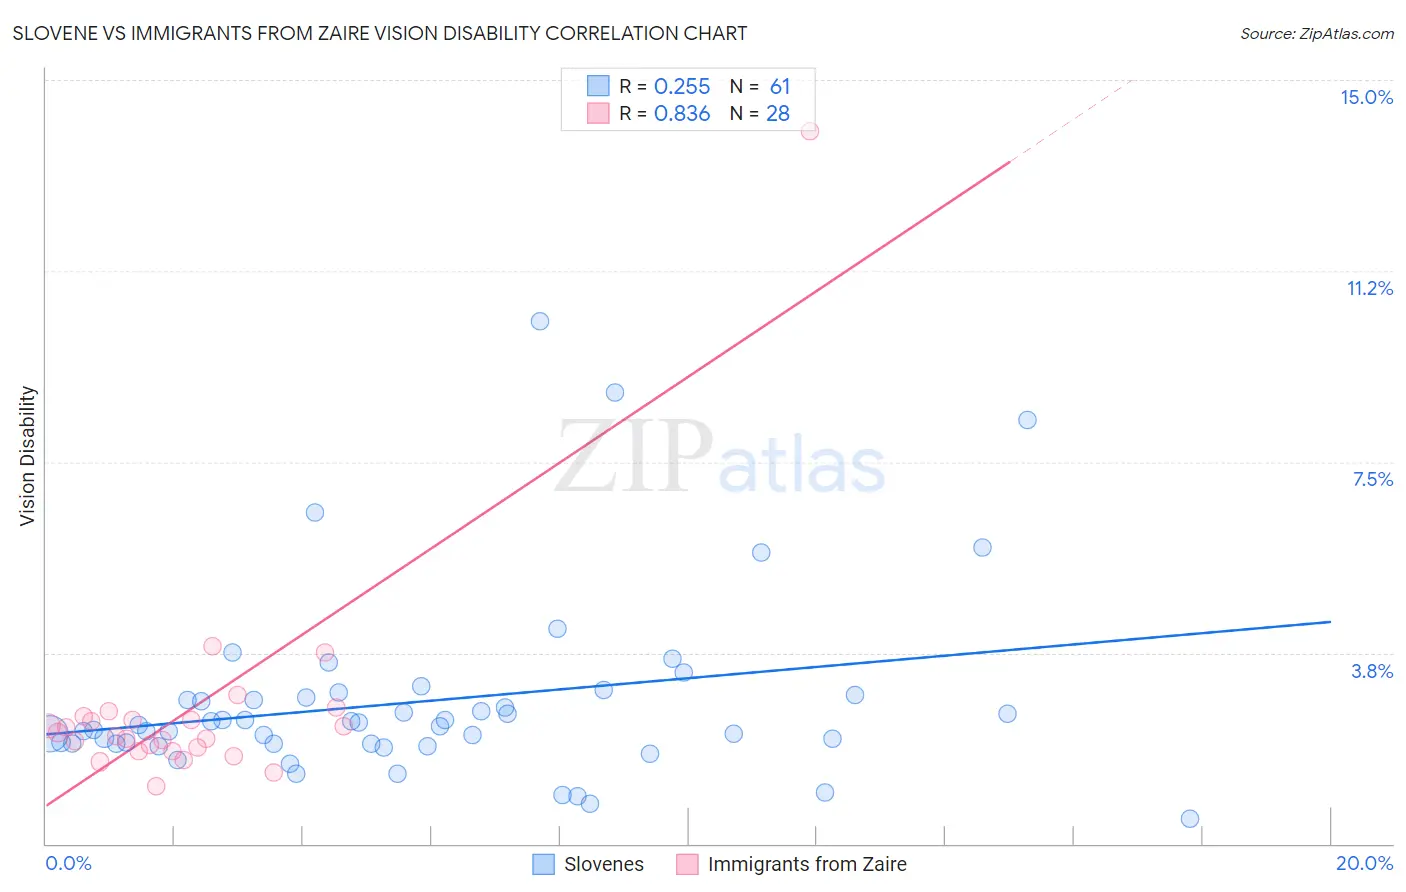
Slovene vs Immigrants from Zaire Vision Disability Correlation Chart
The statistical analysis conducted on geographies consisting of 261,215,676 people shows a weak positive correlation between the proportion of Slovenes and percentage of population with vision disability in the United States with a correlation coefficient (R) of 0.255 and weighted average of 2.1%. Similarly, the statistical analysis conducted on geographies consisting of 107,249,797 people shows a very strong positive correlation between the proportion of Immigrants from Zaire and percentage of population with vision disability in the United States with a correlation coefficient (R) of 0.836 and weighted average of 2.2%, a difference of 4.1%.
Vision Disability Correlation Summary
| Measurement | Slovene | Immigrants from Zaire |
| Minimum | 0.49% | 1.1% |
| Maximum | 10.3% | 14.0% |
| Range | 9.8% | 12.9% |
| Mean | 2.8% | 2.6% |
| Median | 2.3% | 2.1% |
| Interquartile 25% (IQ1) | 2.0% | 1.9% |
| Interquartile 75% (IQ3) | 2.9% | 2.5% |
| Interquartile Range (IQR) | 0.94% | 0.61% |
| Standard Deviation (Sample) | 1.8% | 2.3% |
| Standard Deviation (Population) | 1.8% | 2.3% |
Similar Demographics by Vision Disability
Demographics Similar to Slovenes by Vision Disability
In terms of vision disability, the demographic groups most similar to Slovenes are Immigrants from South America (2.1%, a difference of 0.010%), Immigrants from Southern Europe (2.1%, a difference of 0.080%), Immigrants from Colombia (2.1%, a difference of 0.12%), Immigrants from Norway (2.1%, a difference of 0.16%), and Pakistani (2.1%, a difference of 0.16%).
| Demographics | Rating | Rank | Vision Disability |
| Immigrants | Sudan | 78.4 /100 | #147 | Good 2.1% |
| Finns | 78.3 /100 | #148 | Good 2.1% |
| Colombians | 76.2 /100 | #149 | Good 2.1% |
| Belgians | 75.9 /100 | #150 | Good 2.1% |
| Immigrants | Norway | 75.5 /100 | #151 | Good 2.1% |
| Immigrants | Southern Europe | 74.6 /100 | #152 | Good 2.1% |
| Immigrants | South America | 73.8 /100 | #153 | Good 2.1% |
| Slovenes | 73.6 /100 | #154 | Good 2.1% |
| Immigrants | Colombia | 72.1 /100 | #155 | Good 2.1% |
| Pakistanis | 71.6 /100 | #156 | Good 2.1% |
| Serbians | 70.2 /100 | #157 | Good 2.1% |
| Immigrants | Uzbekistan | 69.9 /100 | #158 | Good 2.1% |
| South Africans | 69.8 /100 | #159 | Good 2.1% |
| Austrians | 69.0 /100 | #160 | Good 2.1% |
| Iraqis | 67.7 /100 | #161 | Good 2.1% |
Demographics Similar to Immigrants from Zaire by Vision Disability
In terms of vision disability, the demographic groups most similar to Immigrants from Zaire are Slovak (2.2%, a difference of 0.090%), Dutch (2.2%, a difference of 0.10%), Immigrants from Thailand (2.2%, a difference of 0.22%), Immigrants from Guyana (2.2%, a difference of 0.23%), and Samoan (2.2%, a difference of 0.25%).
| Demographics | Rating | Rank | Vision Disability |
| Immigrants | Immigrants | 23.7 /100 | #195 | Fair 2.2% |
| Immigrants | Grenada | 23.1 /100 | #196 | Fair 2.2% |
| Ghanaians | 21.8 /100 | #197 | Fair 2.2% |
| Czechoslovakians | 21.6 /100 | #198 | Fair 2.2% |
| Immigrants | El Salvador | 21.0 /100 | #199 | Fair 2.2% |
| Immigrants | Thailand | 20.1 /100 | #200 | Fair 2.2% |
| Slovaks | 18.8 /100 | #201 | Poor 2.2% |
| Immigrants | Zaire | 18.0 /100 | #202 | Poor 2.2% |
| Dutch | 17.1 /100 | #203 | Poor 2.2% |
| Immigrants | Guyana | 15.9 /100 | #204 | Poor 2.2% |
| Samoans | 15.7 /100 | #205 | Poor 2.2% |
| Pennsylvania Germans | 14.5 /100 | #206 | Poor 2.2% |
| Immigrants | Nigeria | 13.5 /100 | #207 | Poor 2.2% |
| Germans | 13.4 /100 | #208 | Poor 2.2% |
| Immigrants | Brazil | 13.1 /100 | #209 | Poor 2.2% |