Russian vs Immigrants from Sri Lanka Female Disability
COMPARE
Russian
Immigrants from Sri Lanka
Female Disability
Female Disability Comparison
Russians
Immigrants from Sri Lanka
11.8%
FEMALE DISABILITY
96.5/ 100
METRIC RATING
124th/ 347
METRIC RANK
10.9%
FEMALE DISABILITY
100.0/ 100
METRIC RATING
22nd/ 347
METRIC RANK
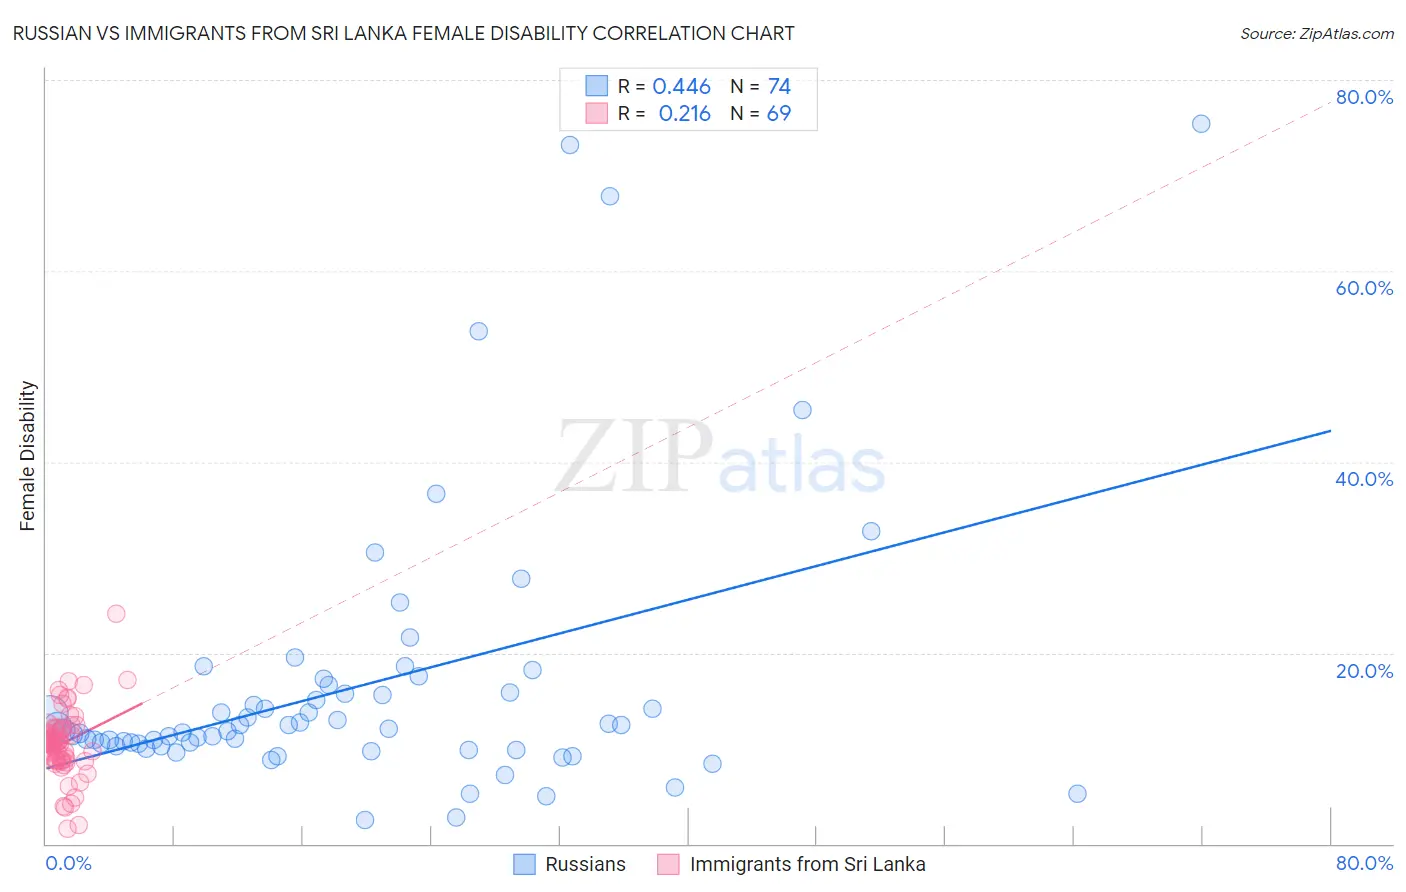
Russian vs Immigrants from Sri Lanka Female Disability Correlation Chart
The statistical analysis conducted on geographies consisting of 512,105,615 people shows a moderate positive correlation between the proportion of Russians and percentage of females with a disability in the United States with a correlation coefficient (R) of 0.446 and weighted average of 11.8%. Similarly, the statistical analysis conducted on geographies consisting of 149,700,552 people shows a weak positive correlation between the proportion of Immigrants from Sri Lanka and percentage of females with a disability in the United States with a correlation coefficient (R) of 0.216 and weighted average of 10.9%, a difference of 8.1%.
Female Disability Correlation Summary
| Measurement | Russian | Immigrants from Sri Lanka |
| Minimum | 2.5% | 1.6% |
| Maximum | 75.4% | 24.0% |
| Range | 73.0% | 22.4% |
| Mean | 16.5% | 10.5% |
| Median | 12.0% | 10.5% |
| Interquartile 25% (IQ1) | 10.3% | 8.8% |
| Interquartile 75% (IQ3) | 15.8% | 12.0% |
| Interquartile Range (IQR) | 5.5% | 3.2% |
| Standard Deviation (Sample) | 14.3% | 3.6% |
| Standard Deviation (Population) | 14.2% | 3.6% |
Similar Demographics by Female Disability
Demographics Similar to Russians by Female Disability
In terms of female disability, the demographic groups most similar to Russians are Immigrants from Italy (11.8%, a difference of 0.030%), Immigrants from Croatia (11.8%, a difference of 0.050%), Immigrants from Europe (11.8%, a difference of 0.090%), Immigrants from North Macedonia (11.8%, a difference of 0.10%), and Immigrants from Netherlands (11.8%, a difference of 0.11%).
| Demographics | Rating | Rank | Female Disability |
| Immigrants | Eastern Europe | 97.2 /100 | #117 | Exceptional 11.8% |
| Immigrants | Nigeria | 97.2 /100 | #118 | Exceptional 11.8% |
| Immigrants | Uganda | 97.2 /100 | #119 | Exceptional 11.8% |
| Immigrants | Kazakhstan | 97.0 /100 | #120 | Exceptional 11.8% |
| Immigrants | Netherlands | 96.9 /100 | #121 | Exceptional 11.8% |
| Immigrants | North Macedonia | 96.8 /100 | #122 | Exceptional 11.8% |
| Immigrants | Croatia | 96.7 /100 | #123 | Exceptional 11.8% |
| Russians | 96.5 /100 | #124 | Exceptional 11.8% |
| Immigrants | Italy | 96.4 /100 | #125 | Exceptional 11.8% |
| Immigrants | Europe | 96.2 /100 | #126 | Exceptional 11.8% |
| South American Indians | 95.8 /100 | #127 | Exceptional 11.8% |
| Immigrants | Latvia | 95.6 /100 | #128 | Exceptional 11.8% |
| Macedonians | 95.5 /100 | #129 | Exceptional 11.8% |
| Nicaraguans | 95.2 /100 | #130 | Exceptional 11.9% |
| Arabs | 95.1 /100 | #131 | Exceptional 11.9% |
Demographics Similar to Immigrants from Sri Lanka by Female Disability
In terms of female disability, the demographic groups most similar to Immigrants from Sri Lanka are Asian (10.9%, a difference of 0.13%), Venezuelan (11.0%, a difference of 0.22%), Immigrants from Pakistan (10.9%, a difference of 0.49%), Immigrants from Venezuela (10.9%, a difference of 0.66%), and Immigrants from Argentina (11.0%, a difference of 0.79%).
| Demographics | Rating | Rank | Female Disability |
| Burmese | 100.0 /100 | #15 | Exceptional 10.7% |
| Okinawans | 100.0 /100 | #16 | Exceptional 10.8% |
| Indians (Asian) | 100.0 /100 | #17 | Exceptional 10.8% |
| Immigrants | Iran | 100.0 /100 | #18 | Exceptional 10.8% |
| Immigrants | Venezuela | 100.0 /100 | #19 | Exceptional 10.9% |
| Immigrants | Pakistan | 100.0 /100 | #20 | Exceptional 10.9% |
| Asians | 100.0 /100 | #21 | Exceptional 10.9% |
| Immigrants | Sri Lanka | 100.0 /100 | #22 | Exceptional 10.9% |
| Venezuelans | 100.0 /100 | #23 | Exceptional 11.0% |
| Immigrants | Argentina | 100.0 /100 | #24 | Exceptional 11.0% |
| Immigrants | Asia | 100.0 /100 | #25 | Exceptional 11.0% |
| Argentineans | 100.0 /100 | #26 | Exceptional 11.0% |
| Immigrants | Turkey | 100.0 /100 | #27 | Exceptional 11.1% |
| Egyptians | 100.0 /100 | #28 | Exceptional 11.1% |
| Immigrants | Malaysia | 100.0 /100 | #29 | Exceptional 11.1% |