Russian vs Immigrants from Syria Hearing Disability
COMPARE
Russian
Immigrants from Syria
Hearing Disability
Hearing Disability Comparison
Russians
Immigrants from Syria
3.2%
HEARING DISABILITY
7.1/ 100
METRIC RATING
217th/ 347
METRIC RANK
2.9%
HEARING DISABILITY
85.8/ 100
METRIC RATING
133rd/ 347
METRIC RANK
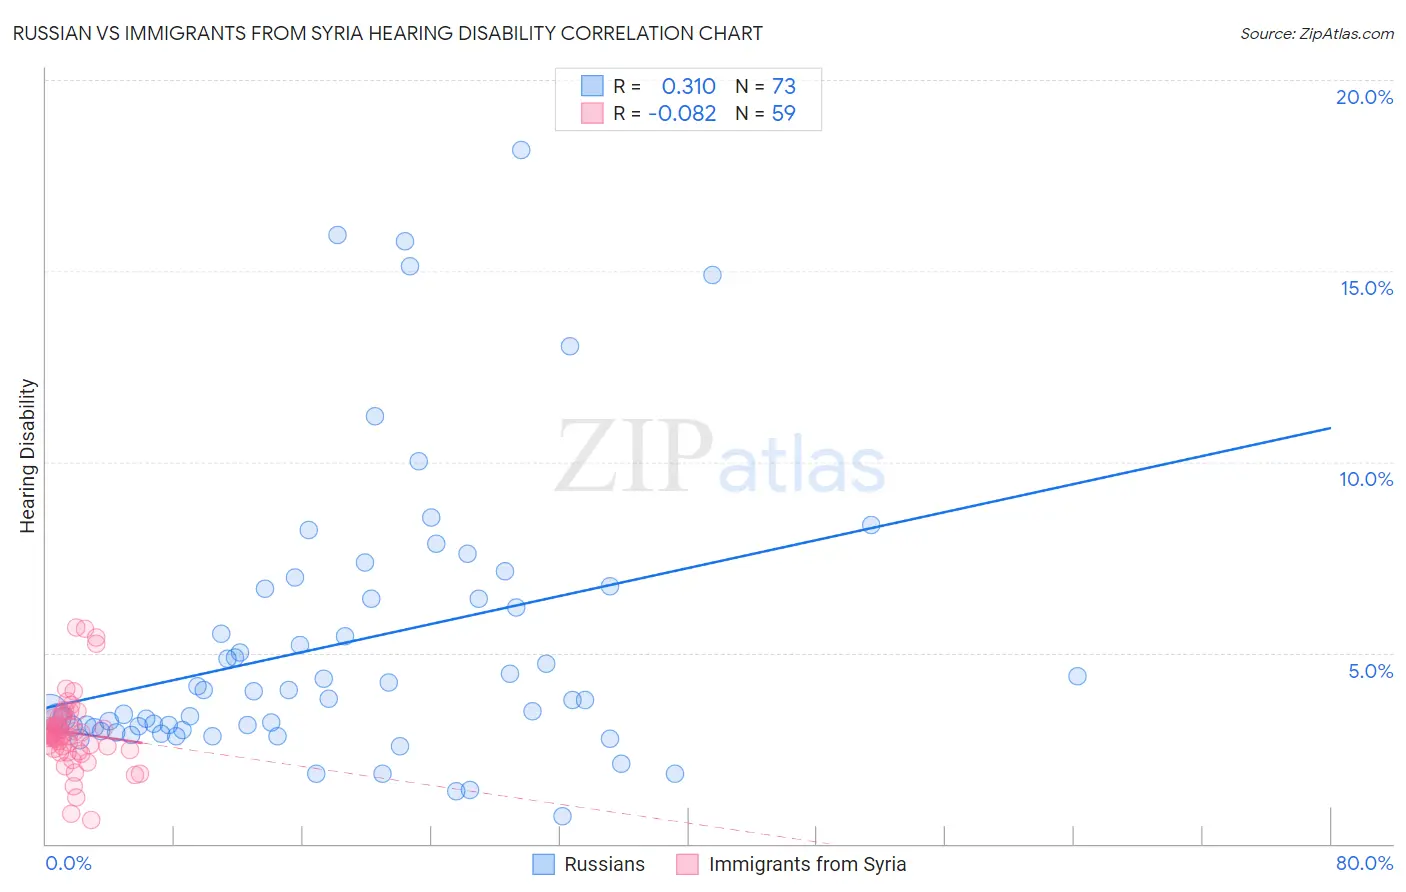
Russian vs Immigrants from Syria Hearing Disability Correlation Chart
The statistical analysis conducted on geographies consisting of 511,868,935 people shows a mild positive correlation between the proportion of Russians and percentage of population with hearing disability in the United States with a correlation coefficient (R) of 0.310 and weighted average of 3.2%. Similarly, the statistical analysis conducted on geographies consisting of 174,100,459 people shows a slight negative correlation between the proportion of Immigrants from Syria and percentage of population with hearing disability in the United States with a correlation coefficient (R) of -0.082 and weighted average of 2.9%, a difference of 10.7%.
Hearing Disability Correlation Summary
| Measurement | Russian | Immigrants from Syria |
| Minimum | 0.73% | 0.64% |
| Maximum | 18.2% | 5.7% |
| Range | 17.5% | 5.0% |
| Mean | 5.2% | 2.9% |
| Median | 3.8% | 2.9% |
| Interquartile 25% (IQ1) | 3.0% | 2.5% |
| Interquartile 75% (IQ3) | 6.5% | 3.3% |
| Interquartile Range (IQR) | 3.5% | 0.85% |
| Standard Deviation (Sample) | 3.7% | 0.97% |
| Standard Deviation (Population) | 3.7% | 0.96% |
Similar Demographics by Hearing Disability
Demographics Similar to Russians by Hearing Disability
In terms of hearing disability, the demographic groups most similar to Russians are Immigrants from Northern Europe (3.2%, a difference of 0.040%), Immigrants from Norway (3.2%, a difference of 0.080%), New Zealander (3.2%, a difference of 0.10%), Malaysian (3.2%, a difference of 0.16%), and Immigrants from Laos (3.2%, a difference of 0.16%).
| Demographics | Rating | Rank | Hearing Disability |
| Cape Verdeans | 12.2 /100 | #210 | Poor 3.1% |
| Romanians | 12.1 /100 | #211 | Poor 3.1% |
| Pakistanis | 11.1 /100 | #212 | Poor 3.1% |
| Immigrants | Iraq | 10.5 /100 | #213 | Poor 3.1% |
| Australians | 8.1 /100 | #214 | Tragic 3.2% |
| Bangladeshis | 8.1 /100 | #215 | Tragic 3.2% |
| Immigrants | Norway | 7.3 /100 | #216 | Tragic 3.2% |
| Russians | 7.1 /100 | #217 | Tragic 3.2% |
| Immigrants | Northern Europe | 7.0 /100 | #218 | Tragic 3.2% |
| New Zealanders | 6.8 /100 | #219 | Tragic 3.2% |
| Malaysians | 6.6 /100 | #220 | Tragic 3.2% |
| Immigrants | Laos | 6.6 /100 | #221 | Tragic 3.2% |
| Immigrants | Oceania | 6.5 /100 | #222 | Tragic 3.2% |
| Mexicans | 5.6 /100 | #223 | Tragic 3.2% |
| Icelanders | 5.2 /100 | #224 | Tragic 3.2% |
Demographics Similar to Immigrants from Syria by Hearing Disability
In terms of hearing disability, the demographic groups most similar to Immigrants from Syria are Chilean (2.9%, a difference of 0.0%), Immigrants from Kenya (2.9%, a difference of 0.060%), Ugandan (2.9%, a difference of 0.070%), Immigrants from Vietnam (2.9%, a difference of 0.14%), and Immigrants from Uganda (2.9%, a difference of 0.16%).
| Demographics | Rating | Rank | Hearing Disability |
| Immigrants | Sudan | 87.8 /100 | #126 | Excellent 2.9% |
| South American Indians | 86.9 /100 | #127 | Excellent 2.9% |
| Immigrants | Western Asia | 86.9 /100 | #128 | Excellent 2.9% |
| Immigrants | Uganda | 86.6 /100 | #129 | Excellent 2.9% |
| Immigrants | Vietnam | 86.5 /100 | #130 | Excellent 2.9% |
| Immigrants | Kenya | 86.1 /100 | #131 | Excellent 2.9% |
| Chileans | 85.8 /100 | #132 | Excellent 2.9% |
| Immigrants | Syria | 85.8 /100 | #133 | Excellent 2.9% |
| Ugandans | 85.5 /100 | #134 | Excellent 2.9% |
| Soviet Union | 84.8 /100 | #135 | Excellent 2.9% |
| Immigrants | Brazil | 84.6 /100 | #136 | Excellent 2.9% |
| Sri Lankans | 84.1 /100 | #137 | Excellent 2.9% |
| Immigrants | Costa Rica | 84.0 /100 | #138 | Excellent 2.9% |
| Bermudans | 83.8 /100 | #139 | Excellent 2.9% |
| Immigrants | Jordan | 83.7 /100 | #140 | Excellent 2.9% |