Russian vs Immigrants Hearing Disability
COMPARE
Russian
Immigrants
Hearing Disability
Hearing Disability Comparison
Russians
Immigrants
3.2%
HEARING DISABILITY
7.1/ 100
METRIC RATING
217th/ 347
METRIC RANK
2.8%
HEARING DISABILITY
90.3/ 100
METRIC RATING
116th/ 347
METRIC RANK
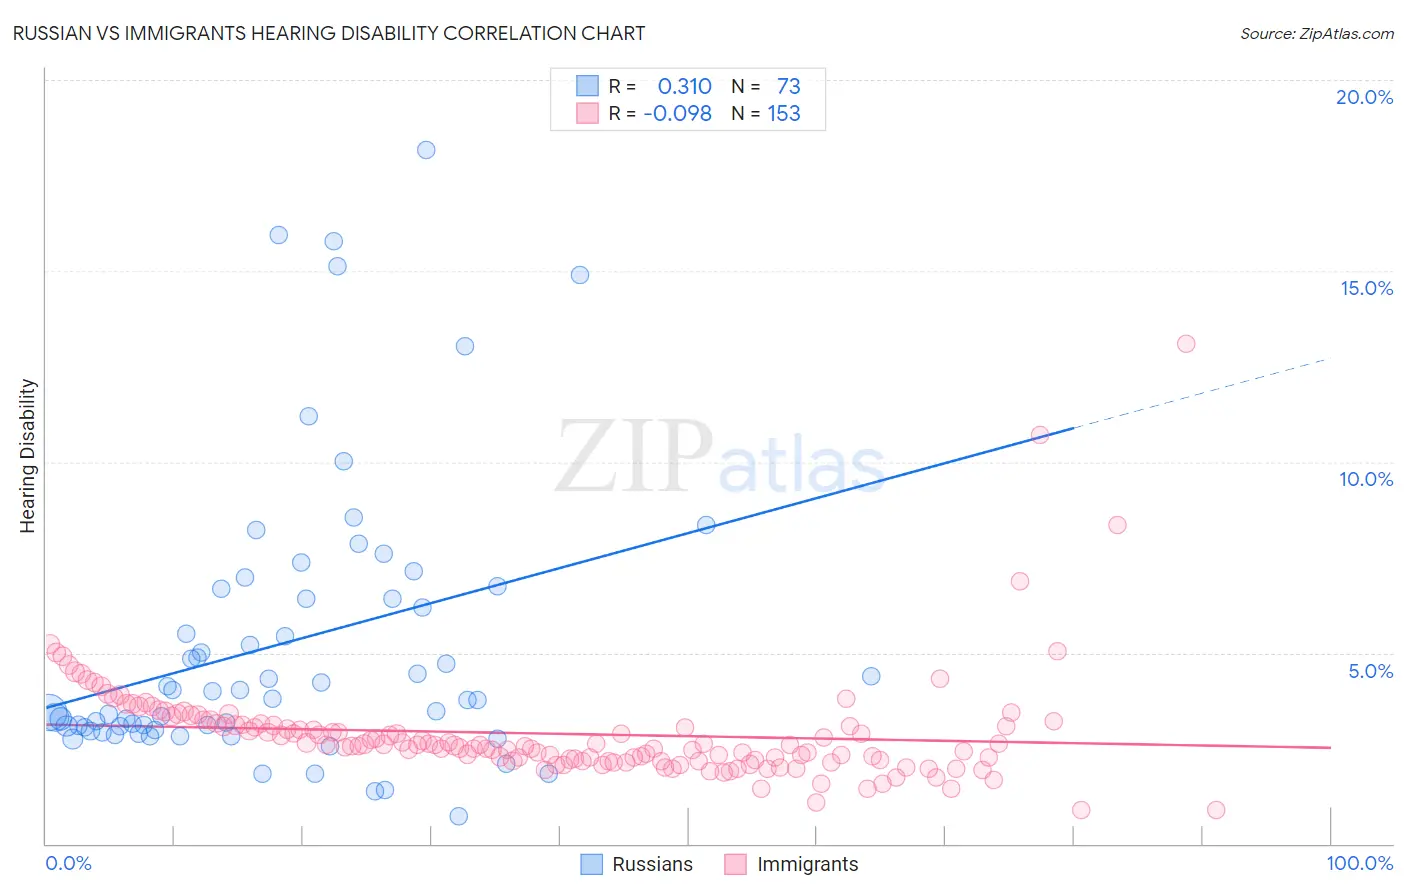
Russian vs Immigrants Hearing Disability Correlation Chart
The statistical analysis conducted on geographies consisting of 511,868,935 people shows a mild positive correlation between the proportion of Russians and percentage of population with hearing disability in the United States with a correlation coefficient (R) of 0.310 and weighted average of 3.2%. Similarly, the statistical analysis conducted on geographies consisting of 576,876,891 people shows a slight negative correlation between the proportion of Immigrants and percentage of population with hearing disability in the United States with a correlation coefficient (R) of -0.098 and weighted average of 2.8%, a difference of 11.9%.
Hearing Disability Correlation Summary
| Measurement | Russian | Immigrants |
| Minimum | 0.73% | 0.87% |
| Maximum | 18.2% | 13.1% |
| Range | 17.5% | 12.2% |
| Mean | 5.2% | 2.9% |
| Median | 3.8% | 2.6% |
| Interquartile 25% (IQ1) | 3.0% | 2.2% |
| Interquartile 75% (IQ3) | 6.5% | 3.1% |
| Interquartile Range (IQR) | 3.5% | 0.95% |
| Standard Deviation (Sample) | 3.7% | 1.4% |
| Standard Deviation (Population) | 3.7% | 1.4% |
Similar Demographics by Hearing Disability
Demographics Similar to Russians by Hearing Disability
In terms of hearing disability, the demographic groups most similar to Russians are Immigrants from Northern Europe (3.2%, a difference of 0.040%), Immigrants from Norway (3.2%, a difference of 0.080%), New Zealander (3.2%, a difference of 0.10%), Malaysian (3.2%, a difference of 0.16%), and Immigrants from Laos (3.2%, a difference of 0.16%).
| Demographics | Rating | Rank | Hearing Disability |
| Cape Verdeans | 12.2 /100 | #210 | Poor 3.1% |
| Romanians | 12.1 /100 | #211 | Poor 3.1% |
| Pakistanis | 11.1 /100 | #212 | Poor 3.1% |
| Immigrants | Iraq | 10.5 /100 | #213 | Poor 3.1% |
| Australians | 8.1 /100 | #214 | Tragic 3.2% |
| Bangladeshis | 8.1 /100 | #215 | Tragic 3.2% |
| Immigrants | Norway | 7.3 /100 | #216 | Tragic 3.2% |
| Russians | 7.1 /100 | #217 | Tragic 3.2% |
| Immigrants | Northern Europe | 7.0 /100 | #218 | Tragic 3.2% |
| New Zealanders | 6.8 /100 | #219 | Tragic 3.2% |
| Malaysians | 6.6 /100 | #220 | Tragic 3.2% |
| Immigrants | Laos | 6.6 /100 | #221 | Tragic 3.2% |
| Immigrants | Oceania | 6.5 /100 | #222 | Tragic 3.2% |
| Mexicans | 5.6 /100 | #223 | Tragic 3.2% |
| Icelanders | 5.2 /100 | #224 | Tragic 3.2% |
Demographics Similar to Immigrants by Hearing Disability
In terms of hearing disability, the demographic groups most similar to Immigrants are Immigrants from Latin America (2.8%, a difference of 0.060%), Immigrants from Liberia (2.8%, a difference of 0.090%), Zimbabwean (2.8%, a difference of 0.10%), Kenyan (2.8%, a difference of 0.12%), and Jordanian (2.8%, a difference of 0.21%).
| Demographics | Rating | Rank | Hearing Disability |
| Turks | 93.0 /100 | #109 | Exceptional 2.8% |
| Cypriots | 92.9 /100 | #110 | Exceptional 2.8% |
| Immigrants | Yemen | 92.7 /100 | #111 | Exceptional 2.8% |
| U.S. Virgin Islanders | 92.5 /100 | #112 | Exceptional 2.8% |
| Immigrants | Belarus | 91.6 /100 | #113 | Exceptional 2.8% |
| Cambodians | 91.1 /100 | #114 | Exceptional 2.8% |
| Immigrants | Latin America | 90.5 /100 | #115 | Exceptional 2.8% |
| Immigrants | Immigrants | 90.3 /100 | #116 | Exceptional 2.8% |
| Immigrants | Liberia | 90.0 /100 | #117 | Excellent 2.8% |
| Zimbabweans | 89.9 /100 | #118 | Excellent 2.8% |
| Kenyans | 89.8 /100 | #119 | Excellent 2.8% |
| Jordanians | 89.5 /100 | #120 | Excellent 2.8% |
| Cubans | 89.4 /100 | #121 | Excellent 2.8% |
| Liberians | 89.0 /100 | #122 | Excellent 2.8% |
| Immigrants | Zaire | 88.6 /100 | #123 | Excellent 2.9% |